Tag: #SP500
-
Weekly Update S&P 500
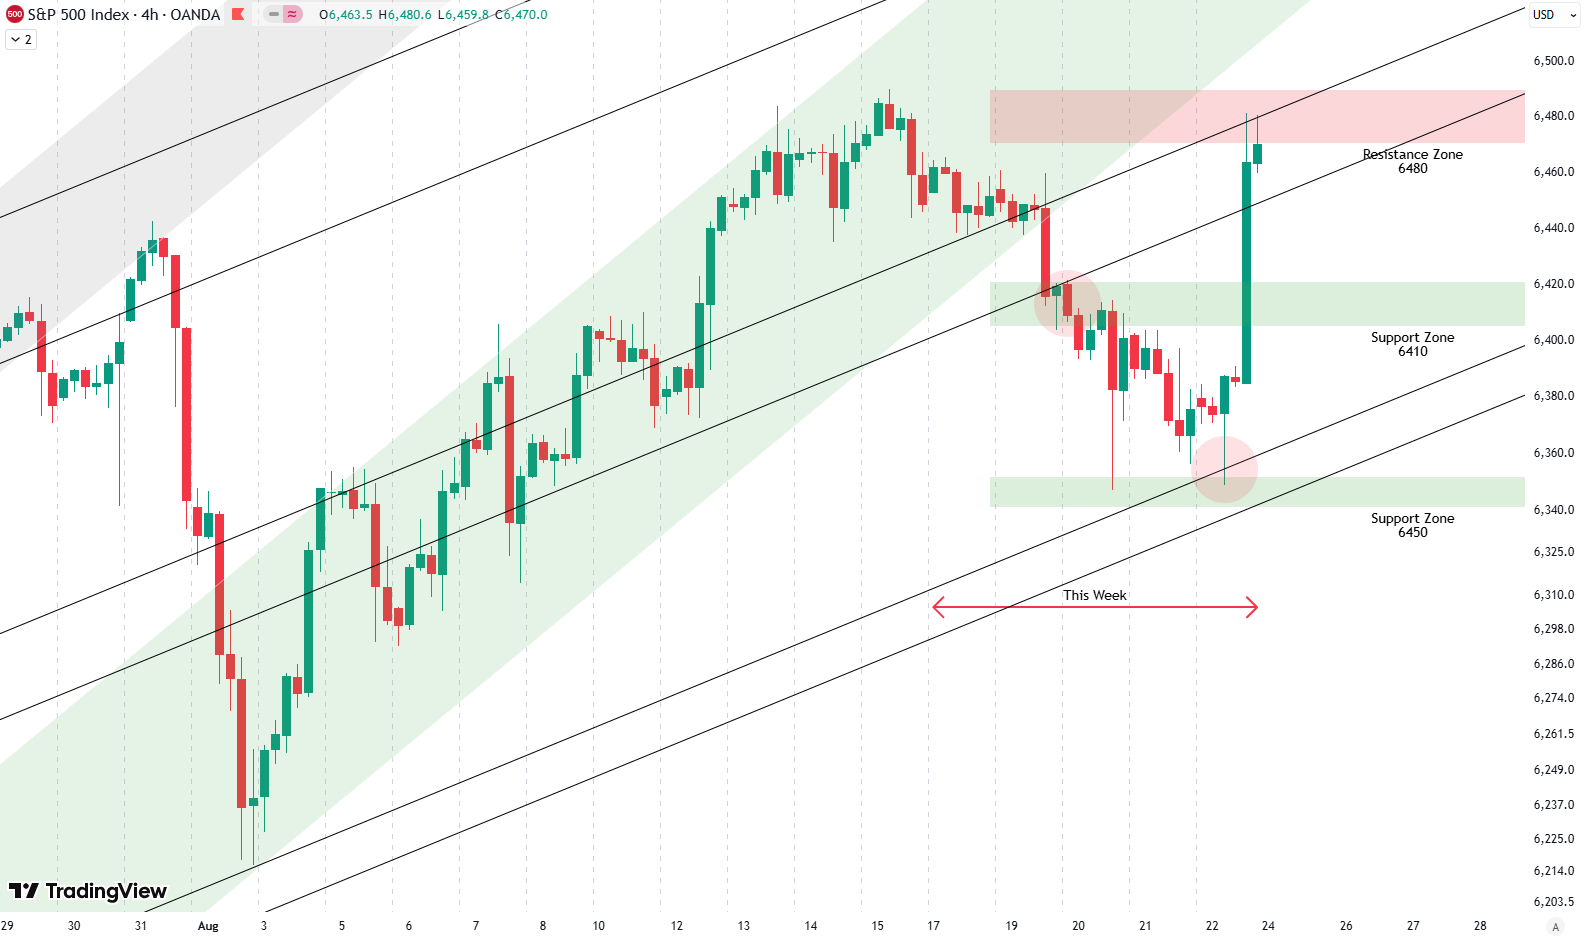
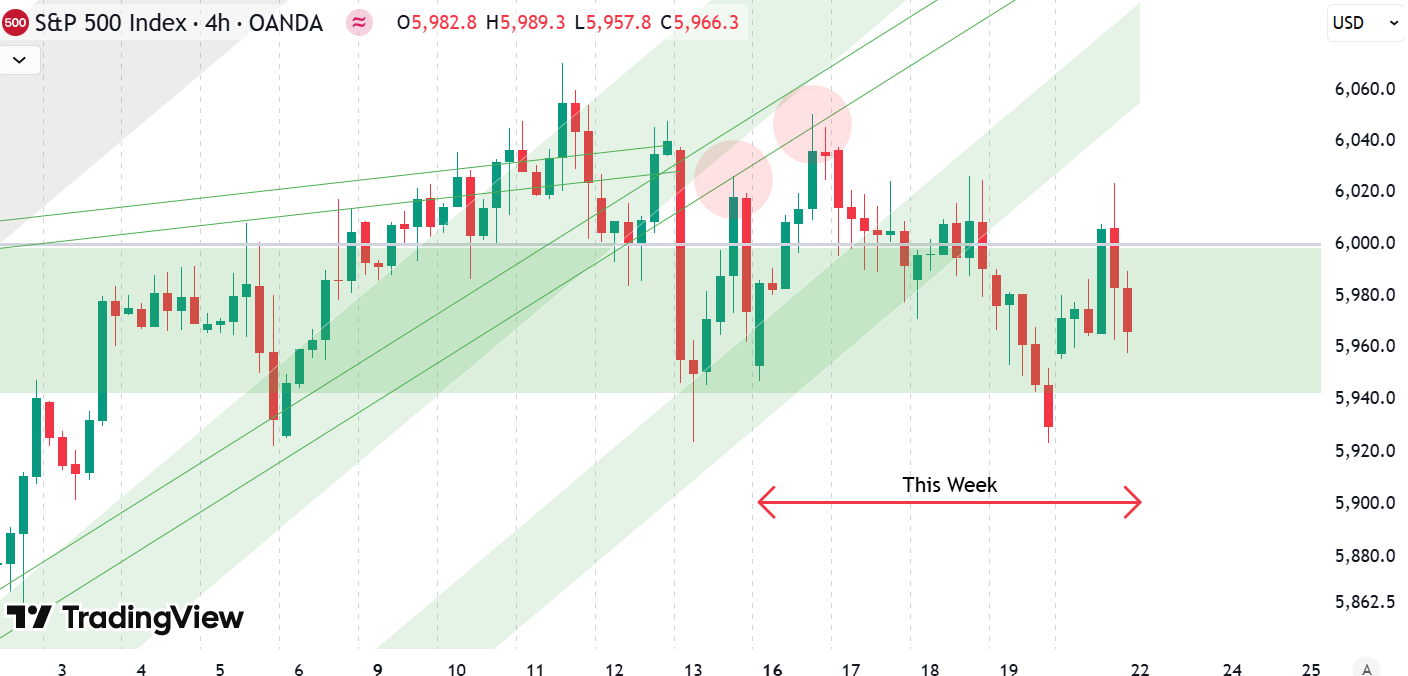
Hello everybody, welcome to this week’s analysis of the S&P 500. This week, the S&P 500 gained 0.3%, with a lot of volatility in between. Looking at the 4-hour chart, we can see that at the beginning of the week, Monday and Tuesday, the S&P 500 moved sideways. We mentioned last week that we should…
-
Weekly Update S&P 500
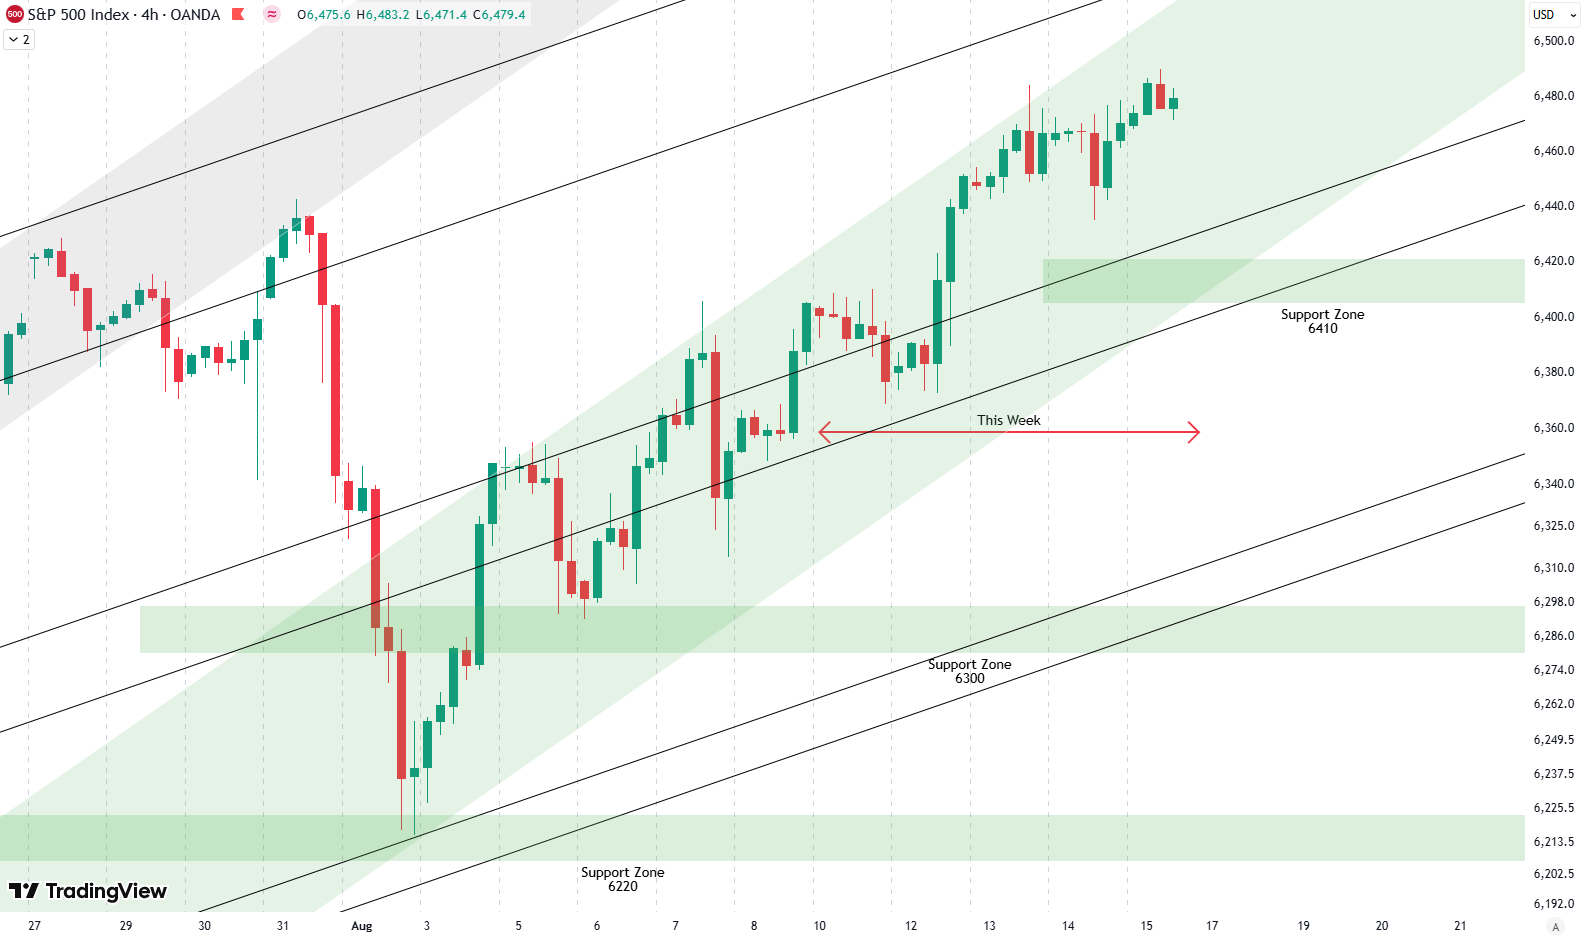
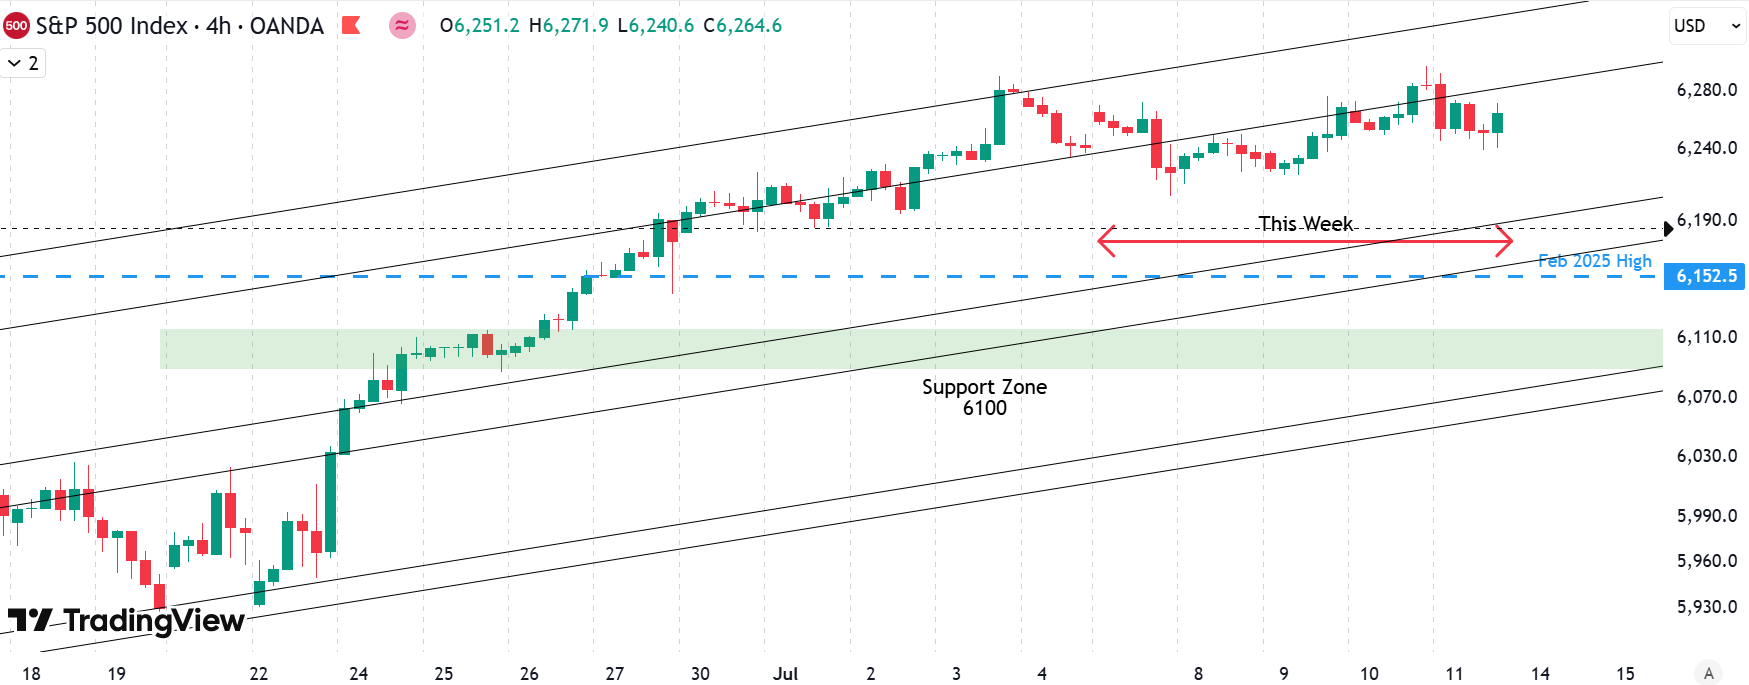
Hello everybody, and welcome to this week’s analysis of the S&P 500. I’m writing this shortly before the New York market opens on Friday, so we don’t yet have the full day’s action included. For now, the S&P 500 is up about 1% this week, and we’ve had some interesting news. On one hand, we…
-
Weekly Update S&P 500
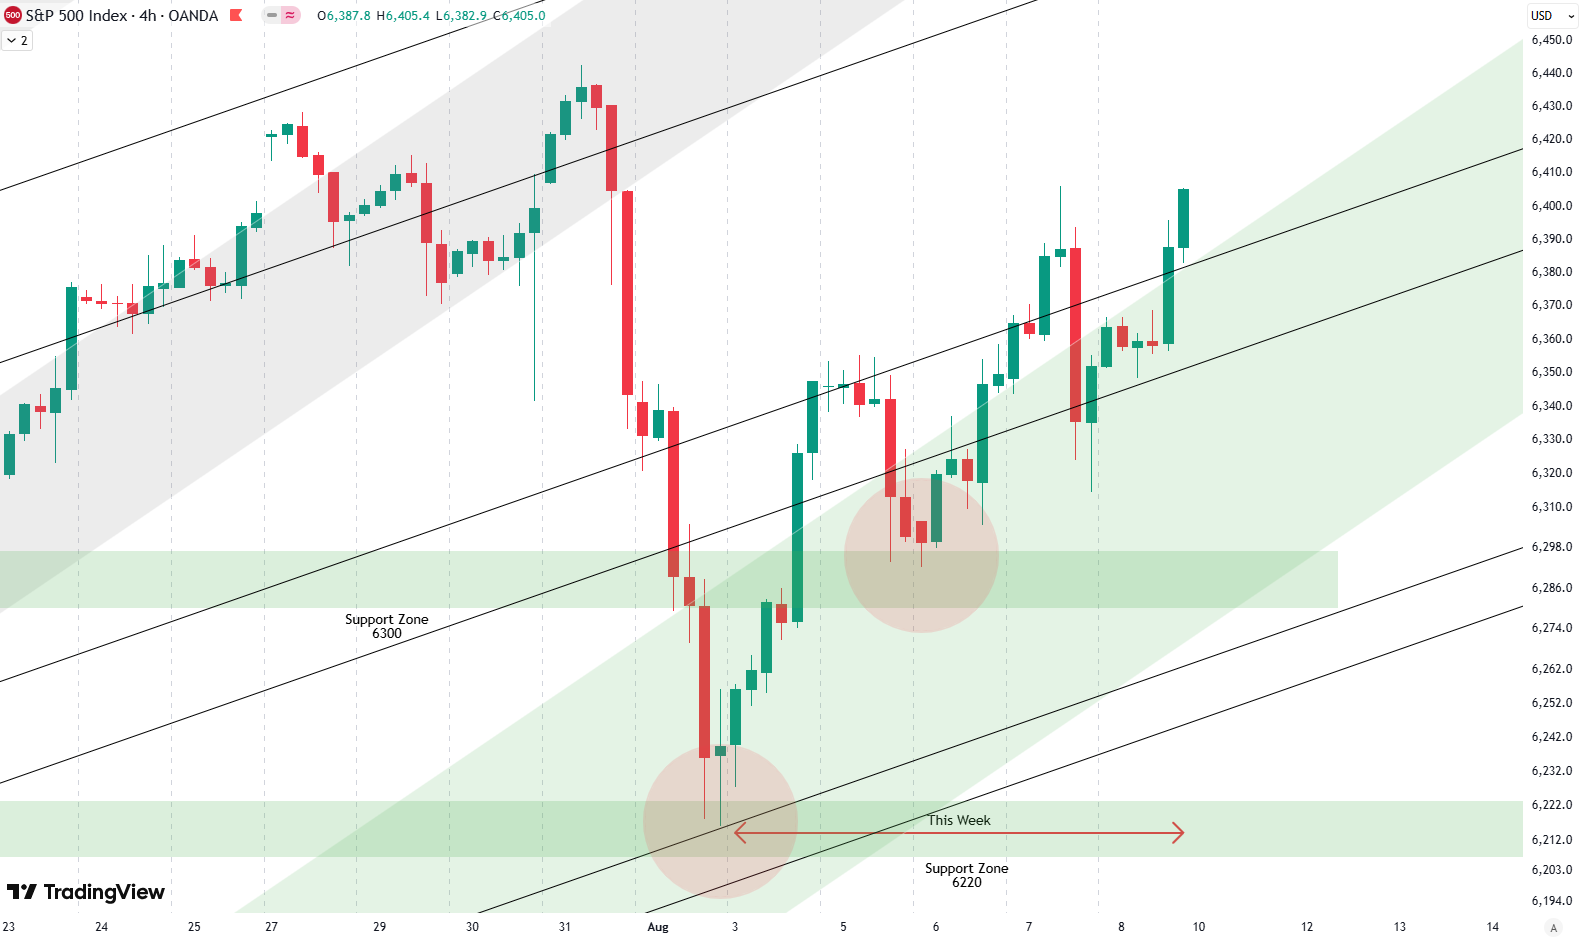
Hello and welcome to this week’s analysis on the S&P 500. The S&P 500 had a very strong gain of 2.6% this week. Looking at the four-hour chart, we can see that last week there was a very big and sharp drop, and the market basically closed the week at the lows of that decline.…
-
Weekly Update S&P 500
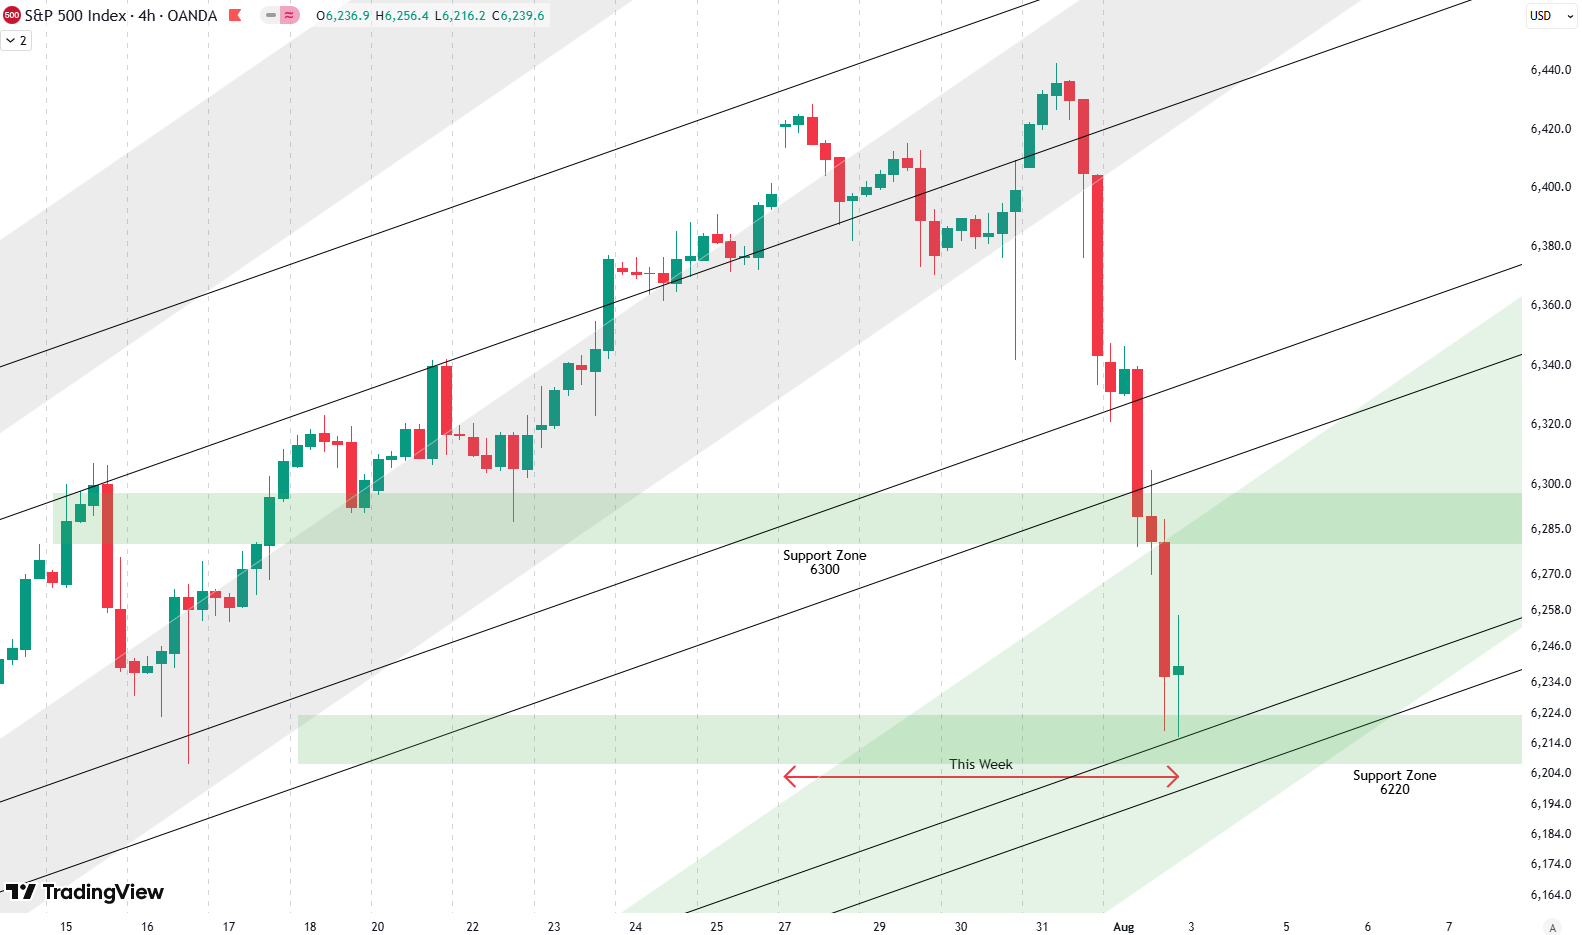
Hello everybody, and welcome to this week’s analysis on the S&P 500. This week, the S&P 500 had a loss of 2,5%. Last week, we talked about how the market was very overbought, and we looked at several downside levels — multiple support zones all the way down to the 6,000-point mark. It appears that…
-
Weekly Update S&P 500
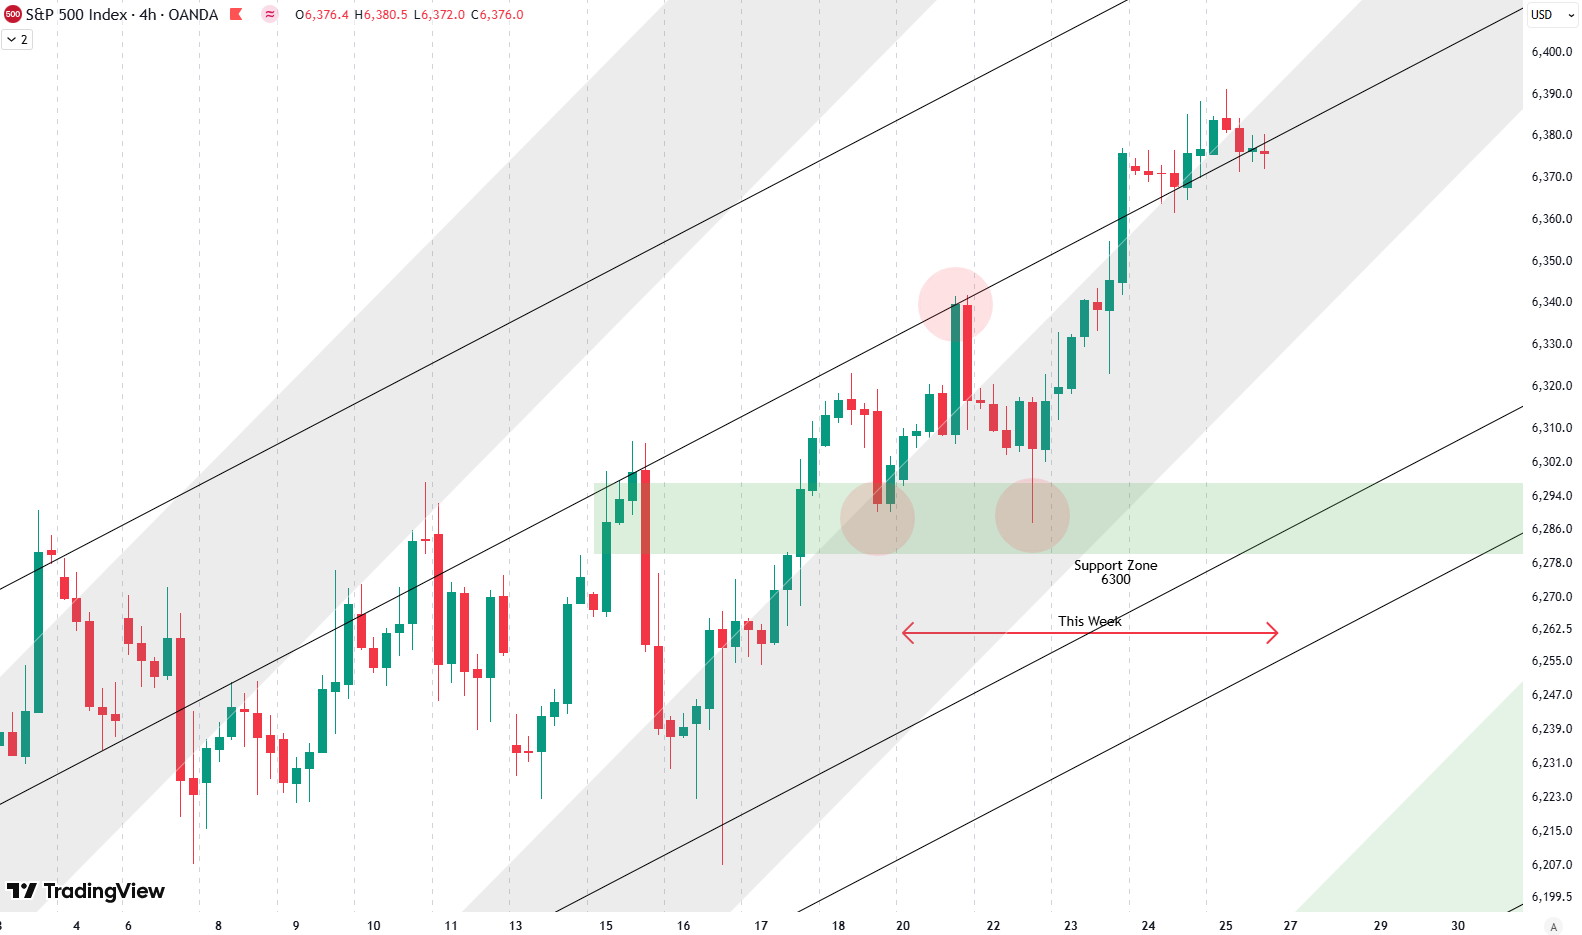
Hello everybody, and welcome to this week’s analysis on the S&P 500. I’m writing this shortly after the New York open on Friday, so far the S&P 500 gained 1,2% this week. We’re looking here at the 4-hour chart. Last week, we discussed the support zone around 6,300 points, which was tested during the late…
-

Weekly Update S&P 500
Welcome to our analysis of this week’s price action on the S&P 500. We begin by looking at the 4-hour chart, where we see the black trend channel that has been in place for a couple of weeks now — as discussed in several of our recent updates. Over the past few weeks, we’ve seen…
-
Weekly Update S&P 500
Welcome to this week’s article. We’re looking at the markets about two hours after the New York open on Friday, so the trading week isn’t fully completed yet. On the 4-hour chart, we can see that not much has happened this week — we had a bit of up and down movement, but overall it…
-
Weekly Update S&P 500
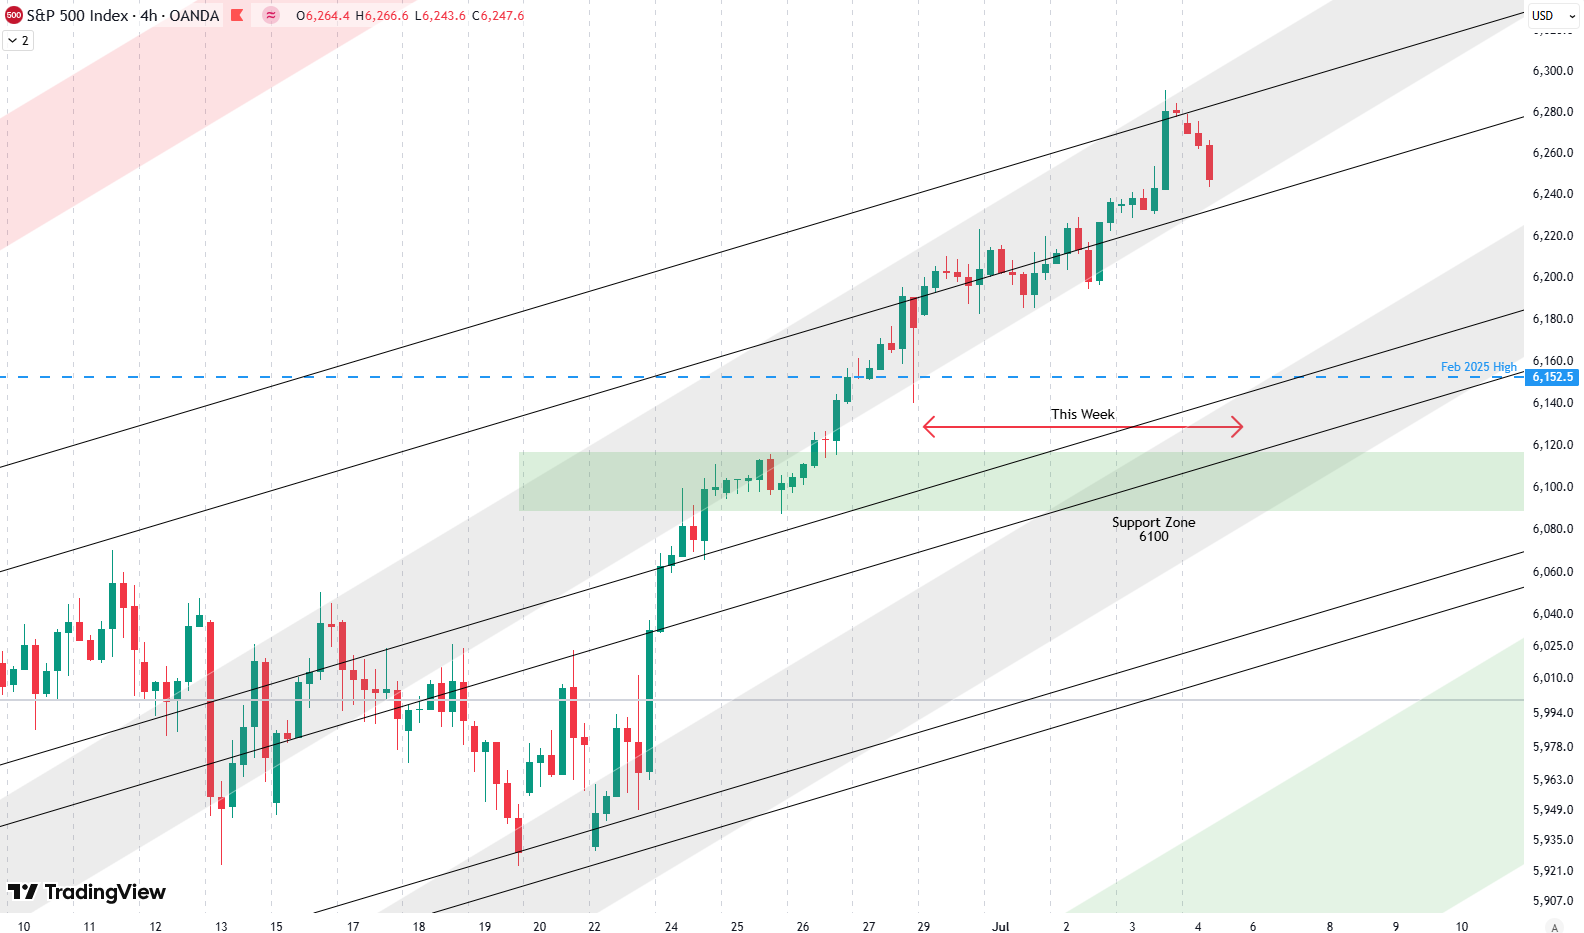
Welcome to this week’s update on the S&P 500. The time of writing is around midday European time on friday, so the trading day and trading week haven’t fully finished yet. However, the 4th of July falls on Friday this year, which is a public holiday in the U.S., so markets will be closed. Because…
-
Weekly Update S&P 500
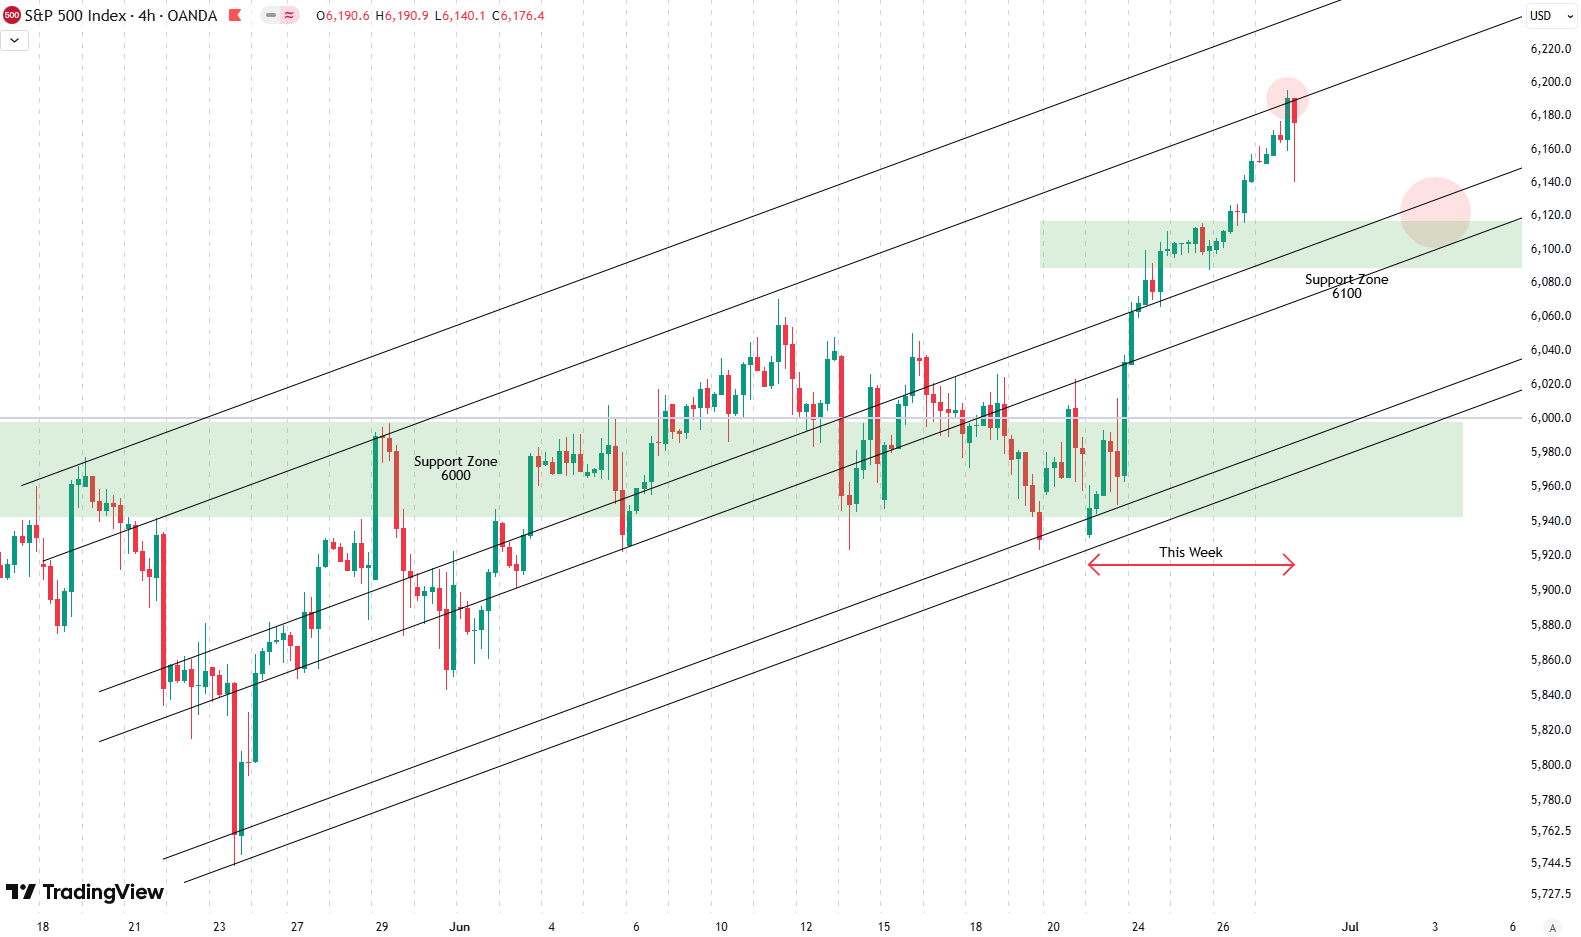
Welcome to our weekly newsletter on the S&P 500. This was quite a week — the S&P 500 posted a very strong gain of 3.3%. Looking at the 4-hour chart, we can see the support zone around the 6,000-point area, where the index had hovered for the last couple of weeks. Last week, we managed…
-
Weekly Update S&P 500
Welcome to this week’s article. This week, the S&P 500 had a very slight loss of -0.1%, so overall, not much happened. But when we dig into this week’s price action, there are some interesting developments to note. Looking at the 4-hour chart, we can see that on Friday of last week, there was a…