Tag: #RiskManagement
-

Top ETFs Near Support: What to Watch and Where to Trim
Welcome to our ETF update. We provide an overview of different ETFs across various asset classes and base our analysis on technicals. We list some ETFs that, from a risk/reward perspective, currently look like good buy opportunities, and others that are better suited as sell or take-profit options right now. Want to know the best…
-
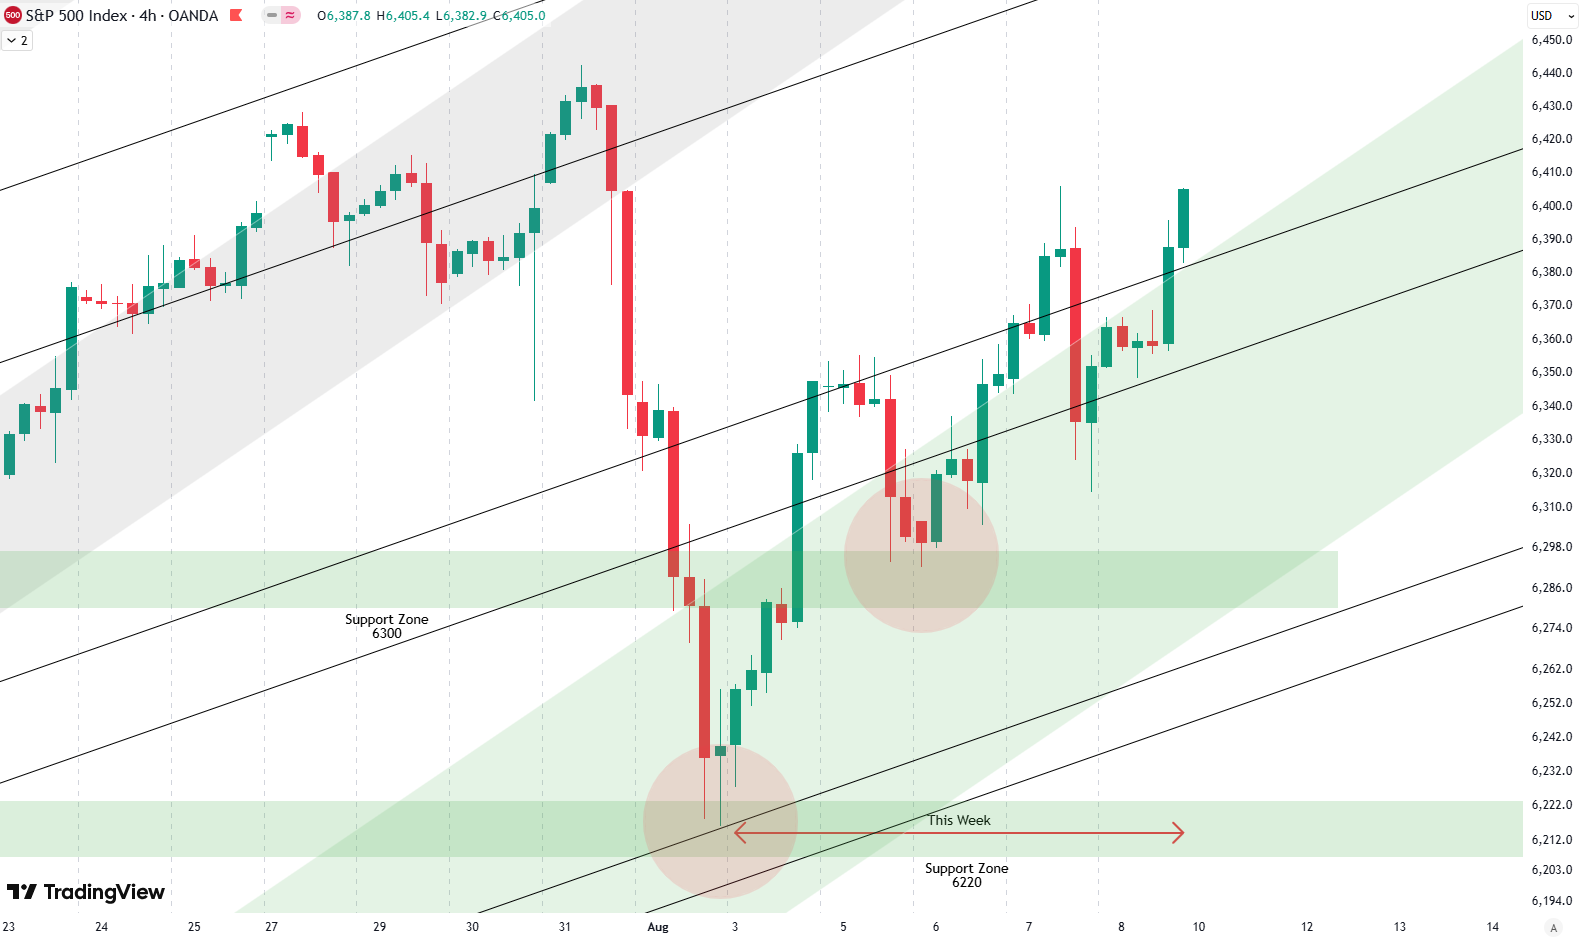
Weekly Update S&P 500
Hello and welcome to this week’s analysis on the S&P 500. The S&P 500 had a very strong gain of 2.6% this week. Looking at the four-hour chart, we can see that last week there was a very big and sharp drop, and the market basically closed the week at the lows of that decline.…
-
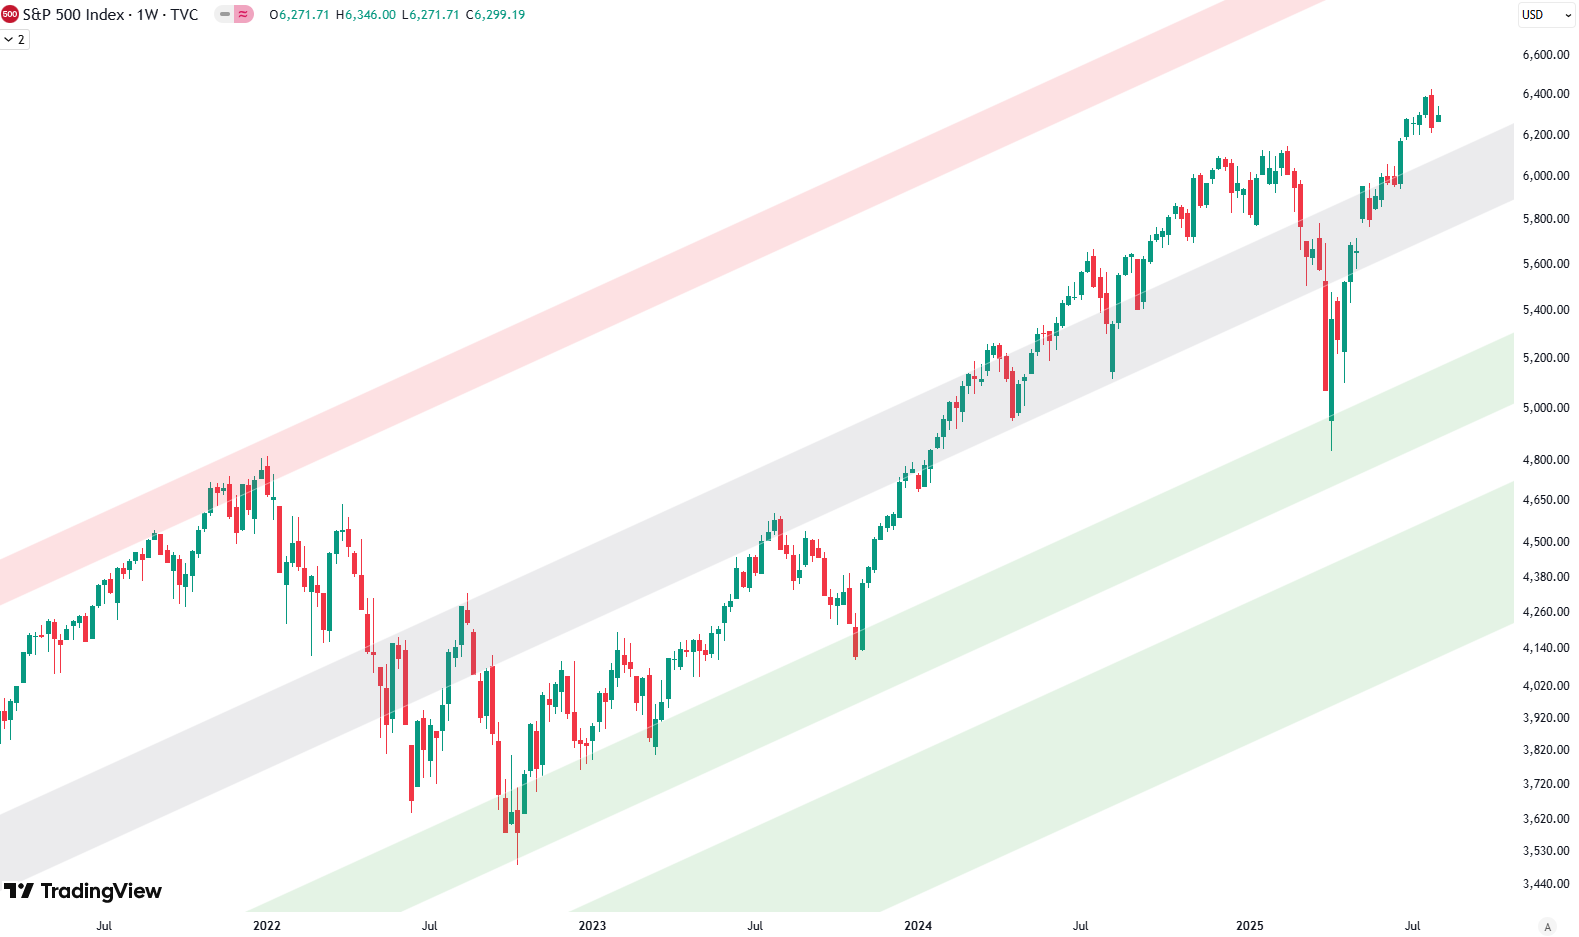
S&P 500: The Big Picture
Hello and welcome to our big picture analysis of the S&P 500. We’re starting here by looking at the monthly and weekly candle charts. We begin with the long-term trend from 2008 to today. We’re in a very clean rising trend channel, which gives us a good sense of the overall structure. To better understand…
-
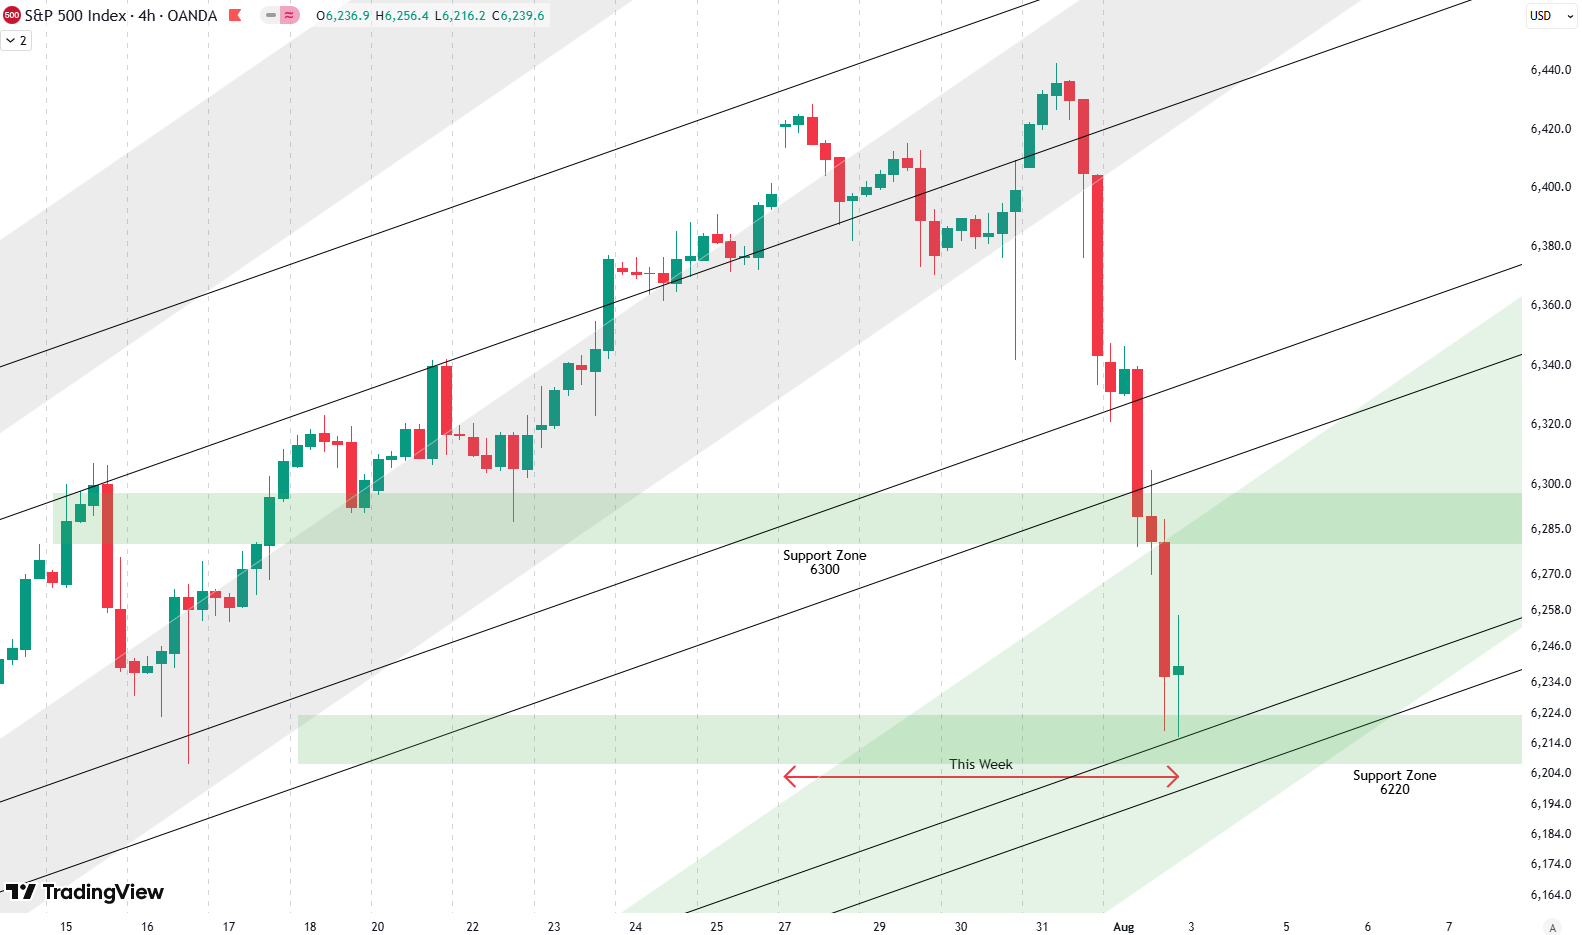
Weekly Update S&P 500
Hello everybody, and welcome to this week’s analysis on the S&P 500. This week, the S&P 500 had a loss of 2,5%. Last week, we talked about how the market was very overbought, and we looked at several downside levels — multiple support zones all the way down to the 6,000-point mark. It appears that…
-
Top ETFs Near Support: What to Watch and Where to Trim
Welcome to our ETF update. We provide an overview of different ETFs across various asset classes and base our analysis on technicals. We list some ETFs that, from a risk/reward perspective, currently look like good buy opportunities, and others that are better suited as sell or take-profit options right now. Want to know the best…
-
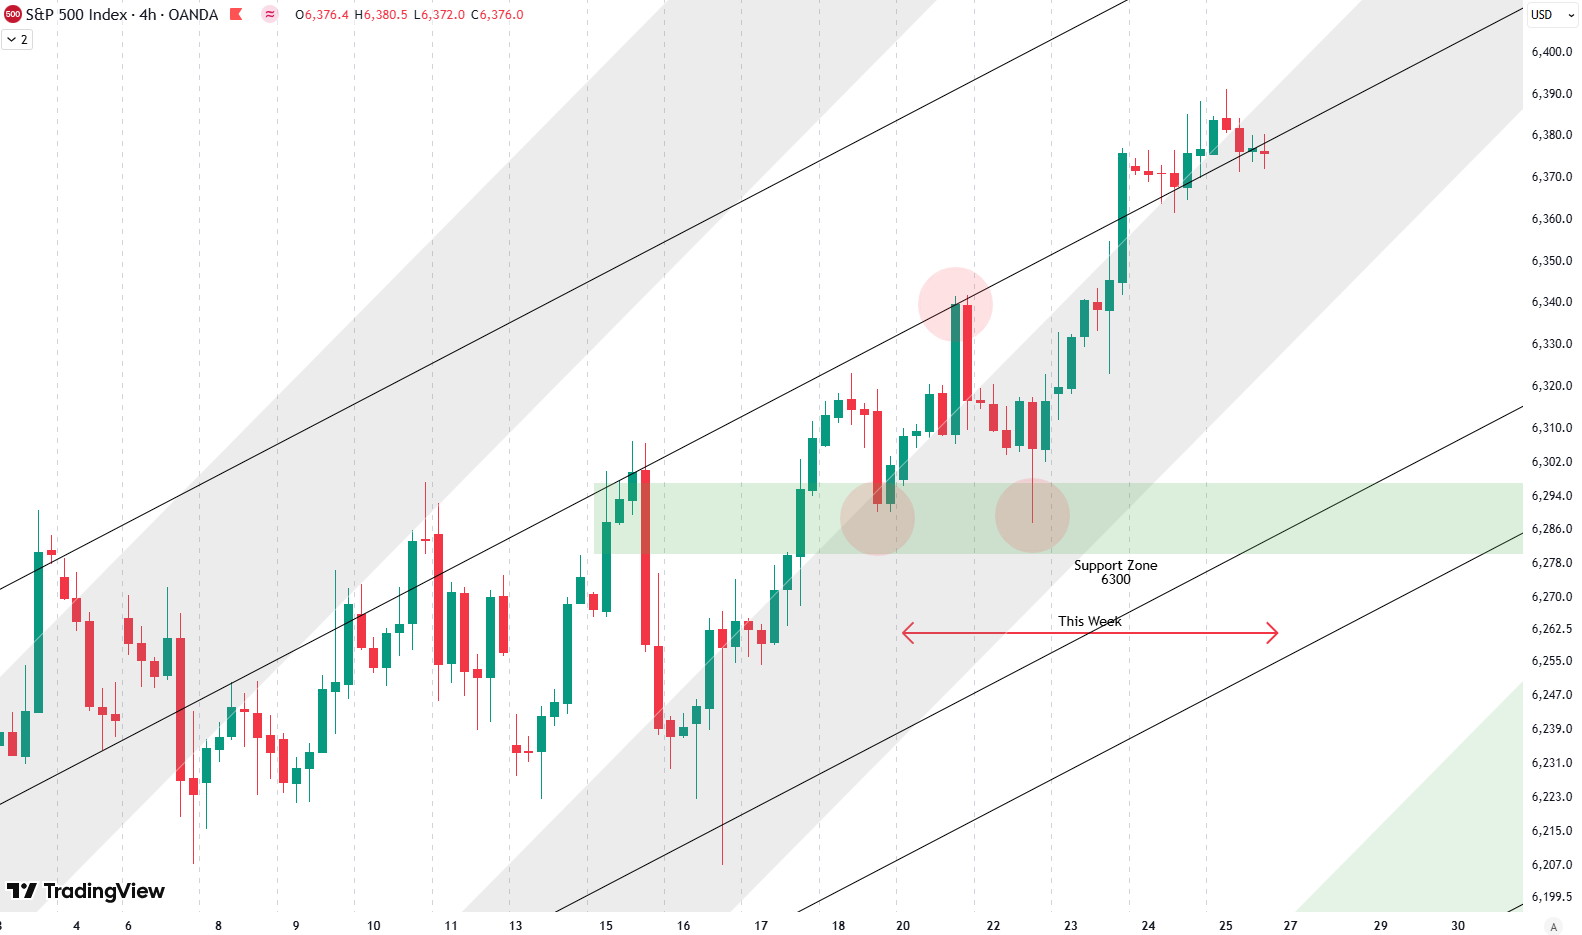
Weekly Update S&P 500
Hello everybody, and welcome to this week’s analysis on the S&P 500. I’m writing this shortly after the New York open on Friday, so far the S&P 500 gained 1,2% this week. We’re looking here at the 4-hour chart. Last week, we discussed the support zone around 6,300 points, which was tested during the late…
-
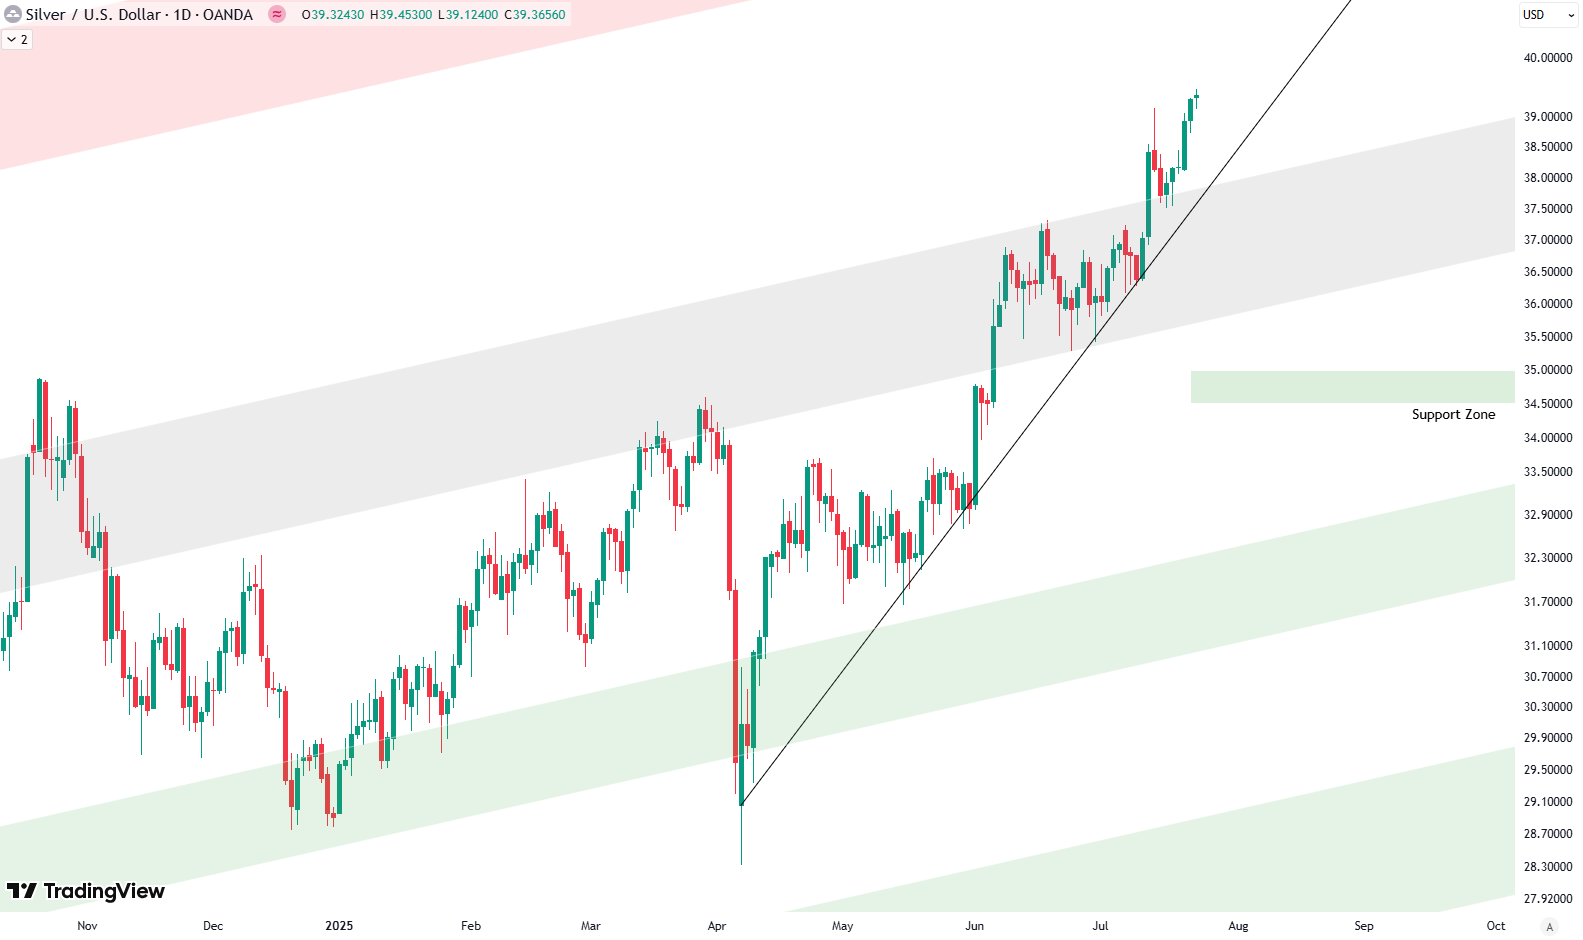
Silver Breaks Out: What the Charts Are Telling Us
Hello everybody. In this week’s article, we’ll take a look at silver, which has made a lot of headlines over the past few weeks because it finally broke out — following gold, which has shown strong price action over the last couple of months. Now, silver was also able to break out with a strong…
-

Weekly Update S&P 500
Welcome to our analysis of this week’s price action on the S&P 500. We begin by looking at the 4-hour chart, where we see the black trend channel that has been in place for a couple of weeks now — as discussed in several of our recent updates. Over the past few weeks, we’ve seen…
-
How We Use Weekly Moving Averages to Guide ETF Entries
Welcome to our ETF update. We provide an overview of different ETFs across various asset classes and base our analysis on technicals. We list some ETFs that, from a risk/reward perspective, currently look like good buy opportunities, and others that are better suited as sell or take-profit options right now. Want to know the best…
-
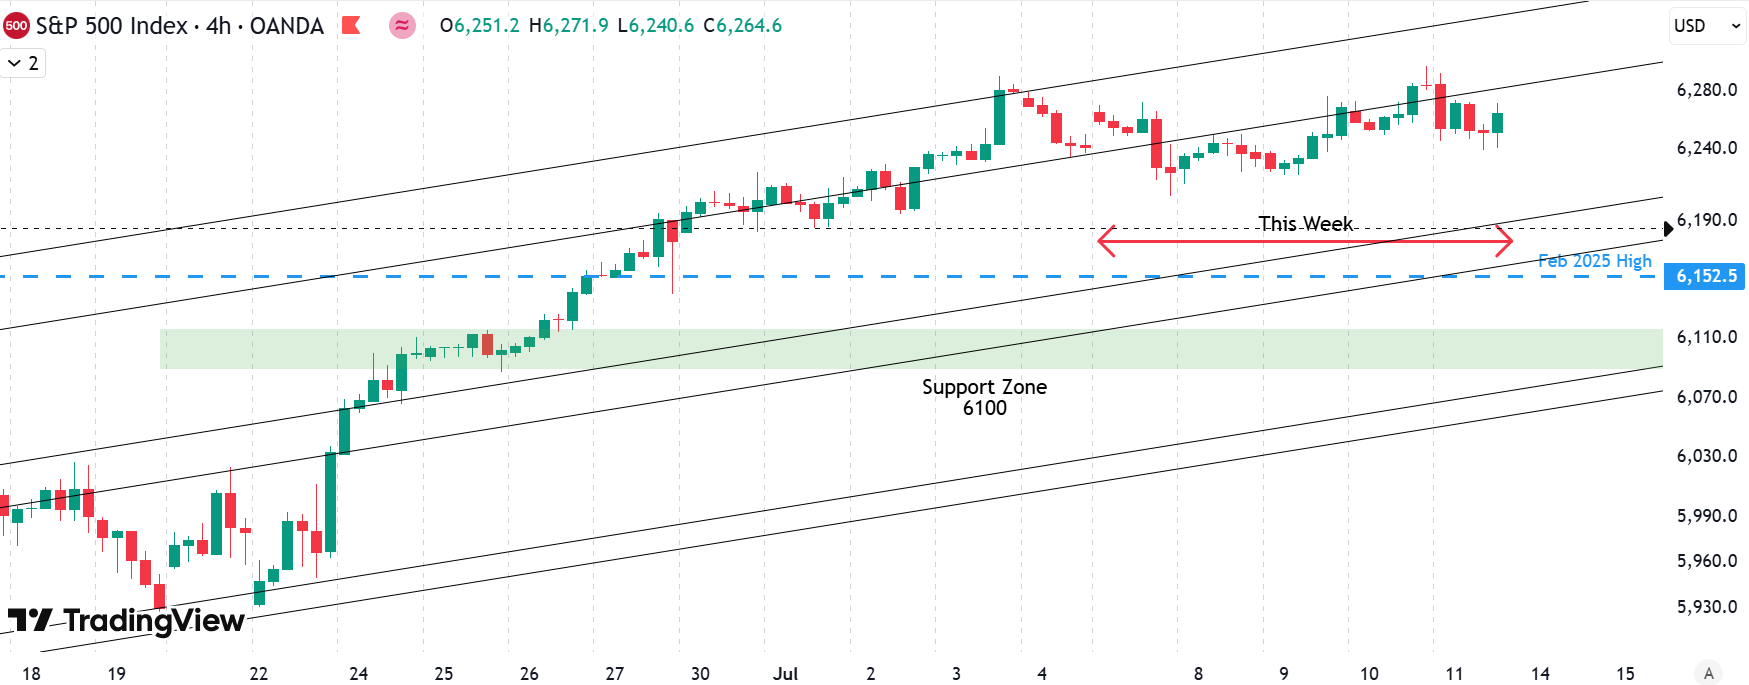
Weekly Update S&P 500
Welcome to this week’s article. We’re looking at the markets about two hours after the New York open on Friday, so the trading week isn’t fully completed yet. On the 4-hour chart, we can see that not much has happened this week — we had a bit of up and down movement, but overall it…