Tag: #MarketAnalysis
-
Weekly Update S&P 500
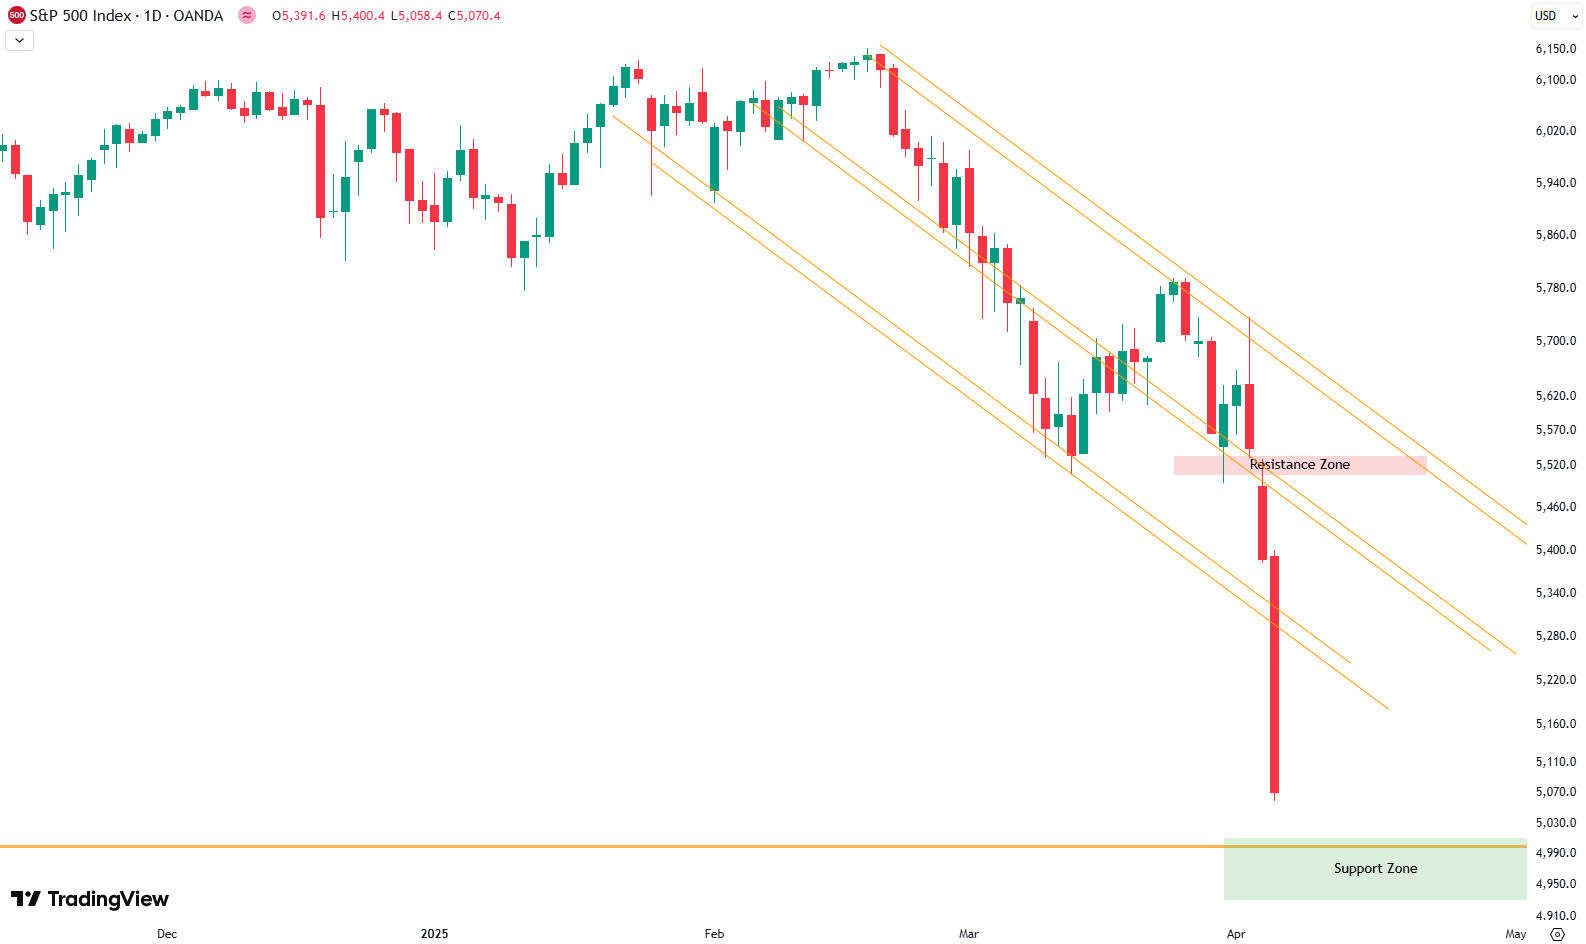
Welcome to our weekly newsletter on the S&P 500. This week was tough—really tough. The S&P 500 lost around 9%, with the index dropping nearly 11% since Wednesday alone. That’s one of the steepest and fastest moves we’ve seen in quite some time. So, what happened? New tariffs were announced midweek. That triggered a rapid…
-
Weekly Update S&P 500
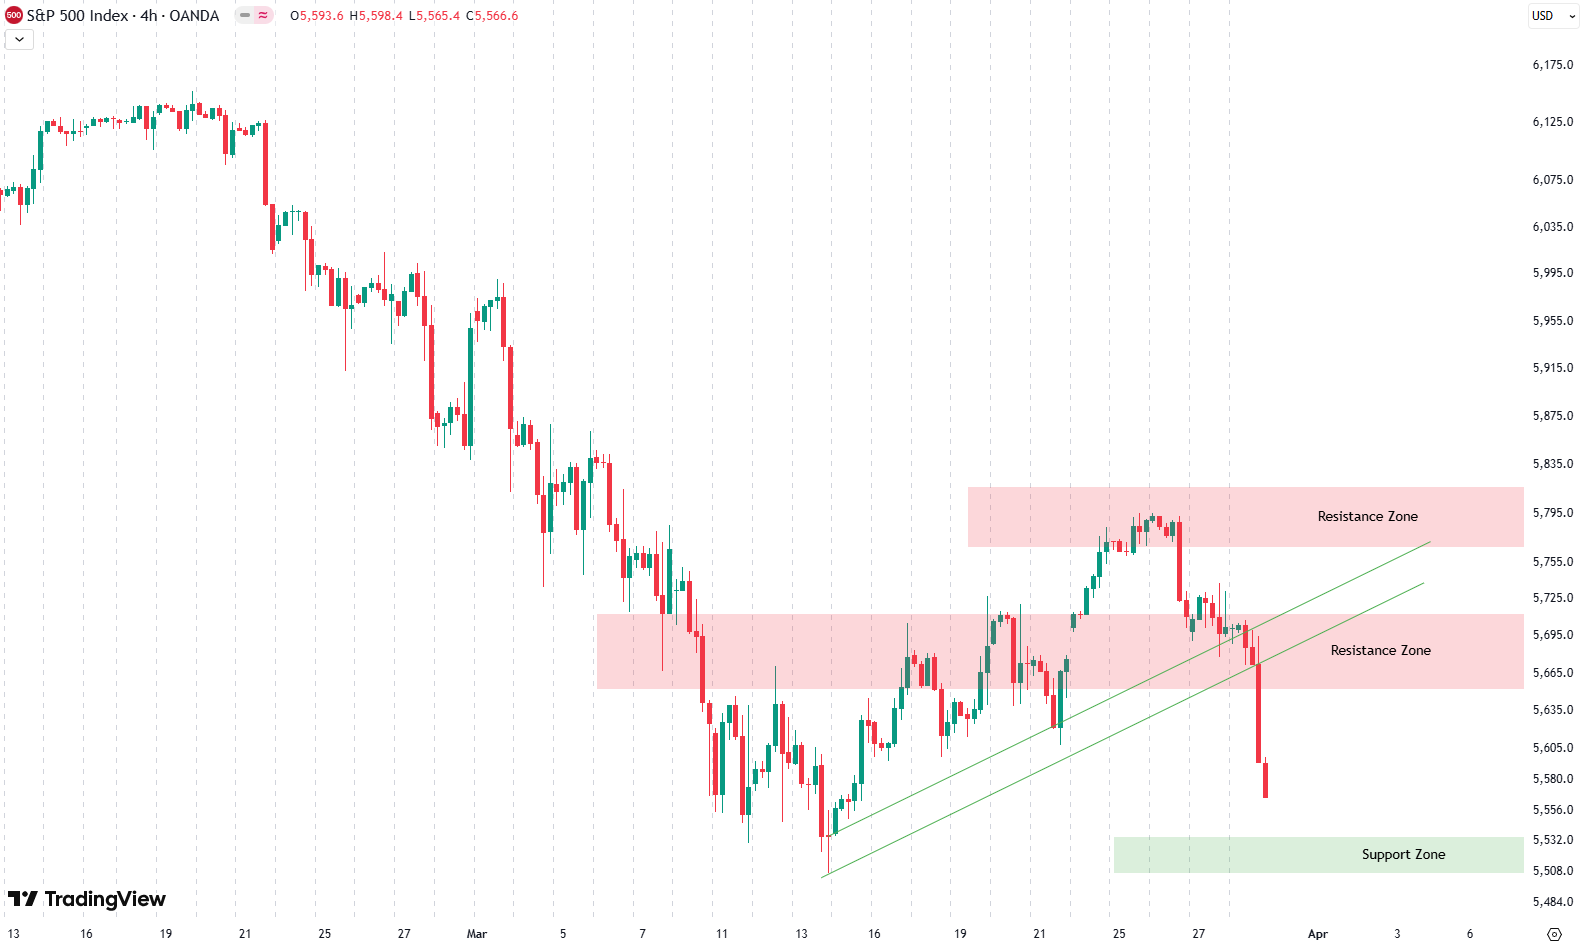
Hello, everybody. This week, the S&P 500 had its share of ups and downs, ultimately ending with a 1.9% loss. On Monday and Tuesday, things were looking quite positive, with some nice gains that had investors feeling optimistic. But, as you can see in the 4-hour chart, the market’s fortunes reversed midweek. On Wednesday, the…
-
Weekly Update S&P 500
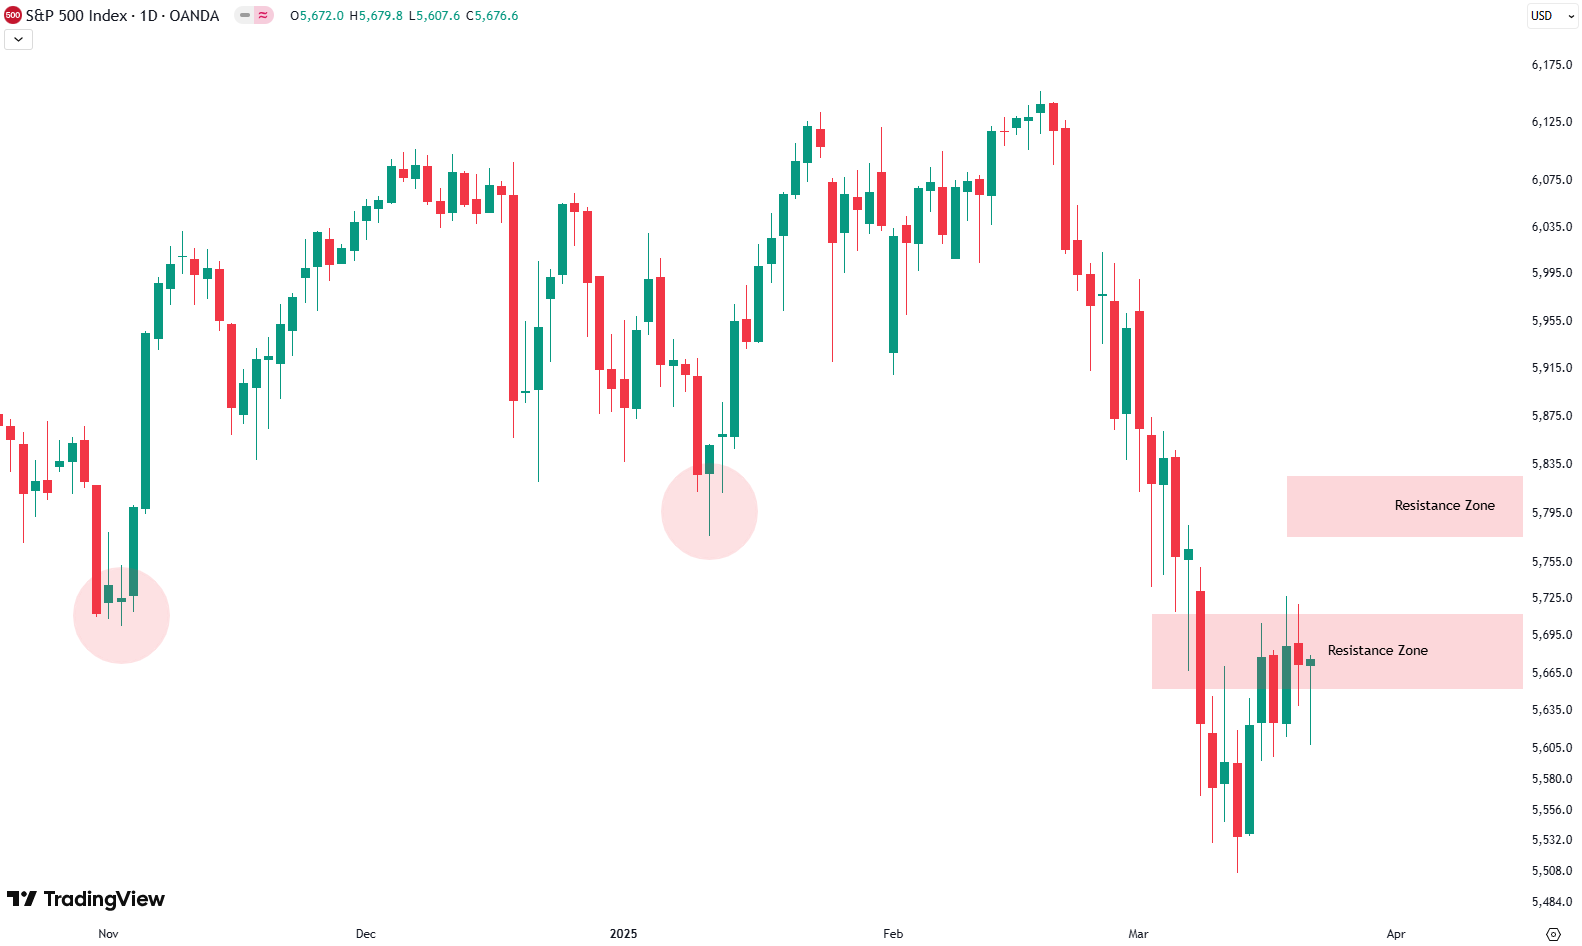
Welcome to our weekly newsletter on the S&P 500! This week, the S&P 500 gained 0.5%. While it wasn’t a massive move, it did bring some important technical patterns into play. Let’s break down what happened on the charts and what it could mean for the coming weeks. Weekly Overview: Testing Key Resistance Levels The…
-
Weekly Update S&P 500
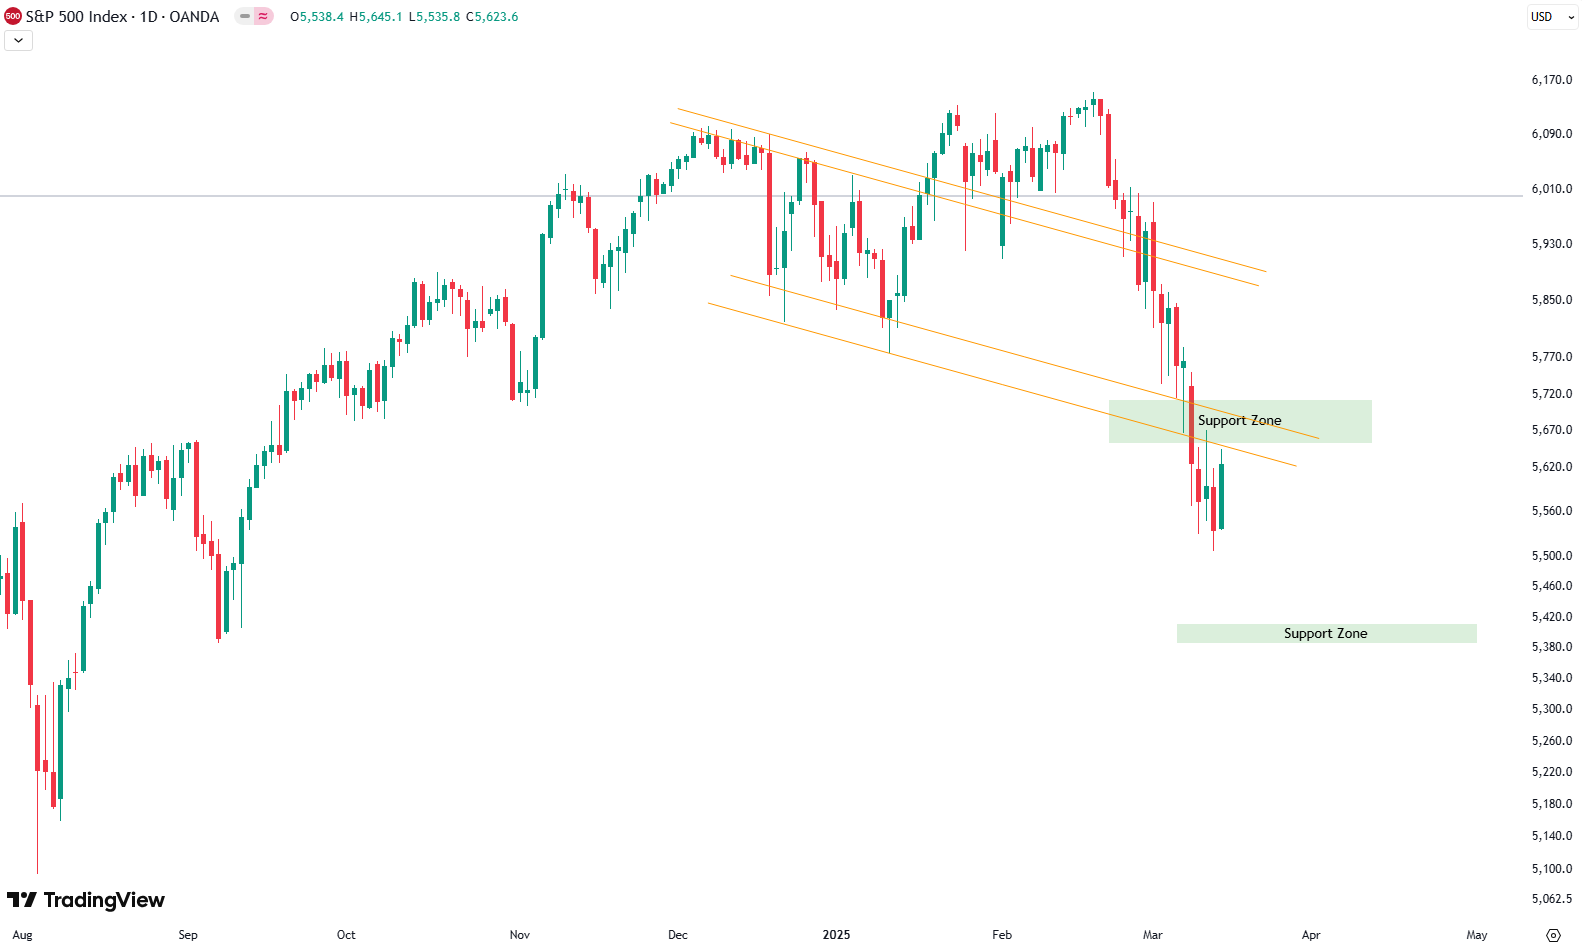
Welcome to our weekly newsletter on the S&P 500! This week was a rough one for the S&P 500, with the index losing 2.5% overall. Monday’s dramatic drop of nearly 3% set the tone, followed by choppy movement on Tuesday and Wednesday, another dip on Thursday, and some recovery on Friday. Looking at the 4-hour…
-
Weekly Update S&P 500
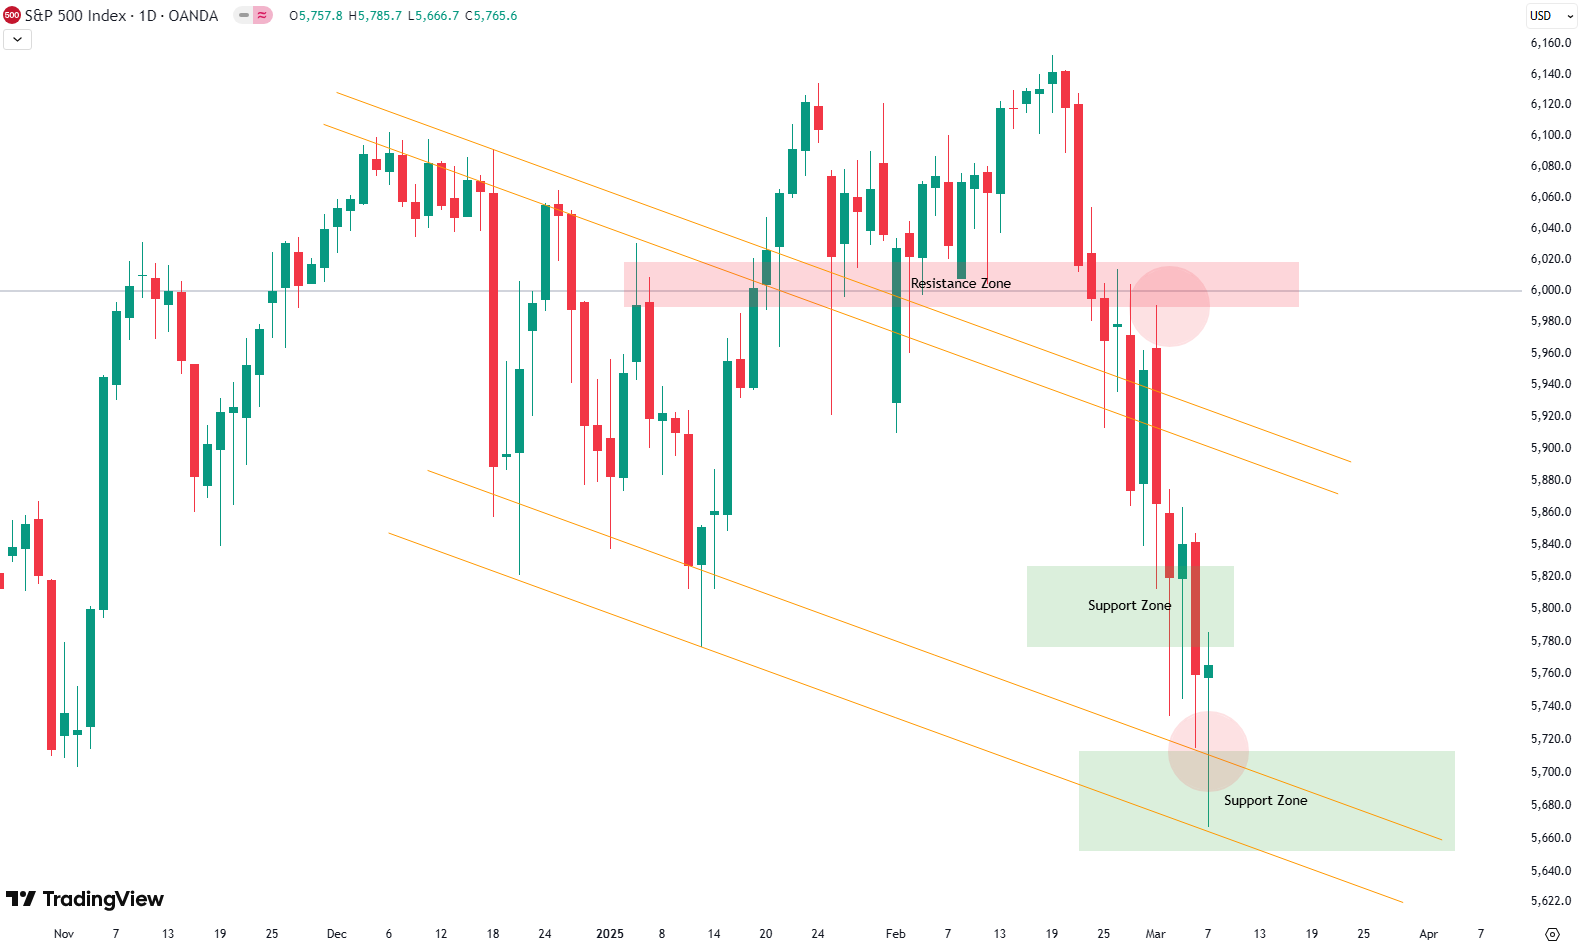
Welcome to our weekly newsletter on the S&P 500! This week, the S&P 500 lost 3.1%, marking another tough week for the market. Looking at the 4-hour chart, we can see how the 6,000-point level—which used to be strong support—has now turned into a resistance zone. As expected, the market saw a bounce on Monday,…
-
Weekly Update S&P 500
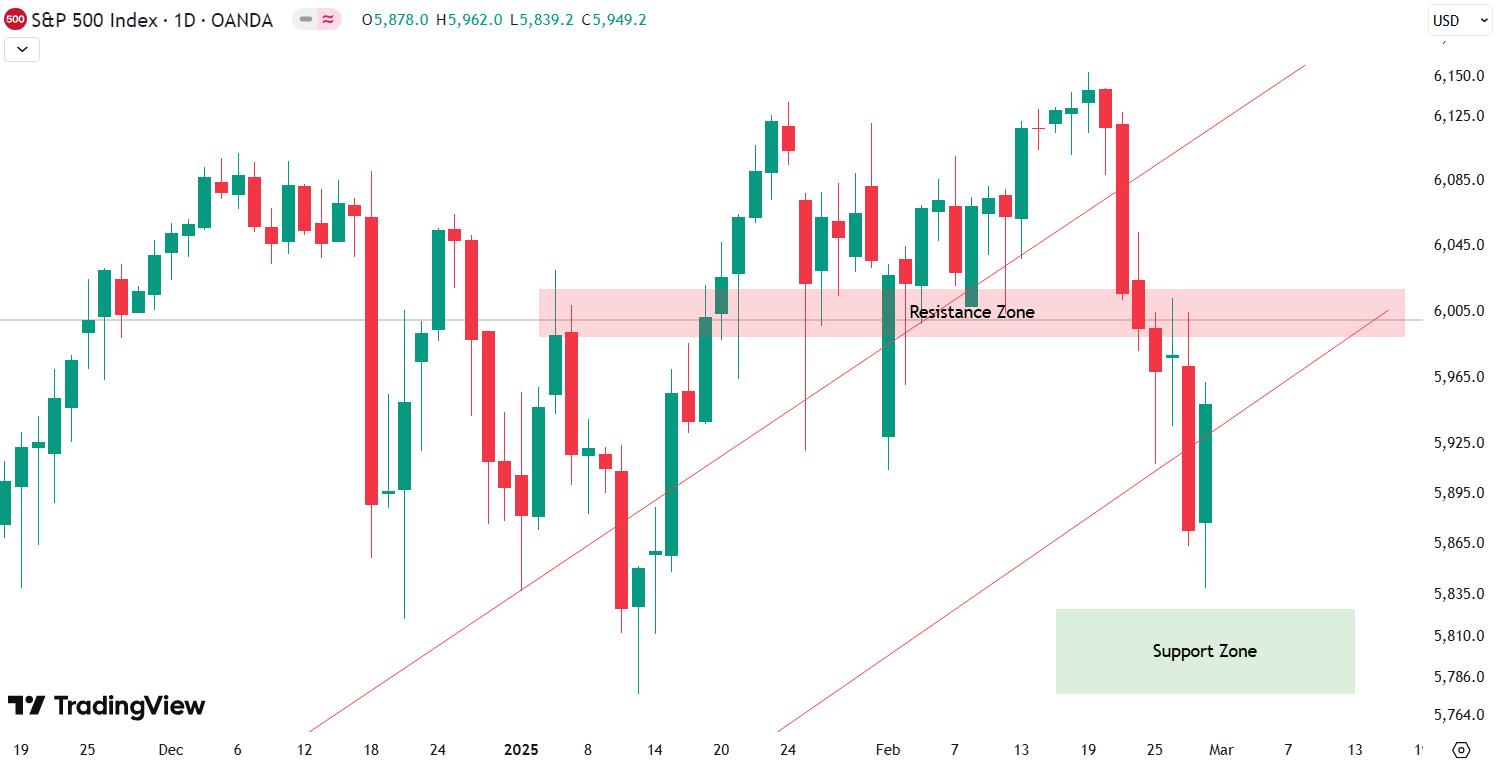
This week, the S&P 500 had a loss of 1.1%. The S&P 500 saw a sharp decline this week. Last week, we pointed out that the index had closed below the green trendline on the chart. At that time, we were still holding above the key 6,000-point support zone. However, this week, sellers took control,…
-
Weekly Update S&P 500
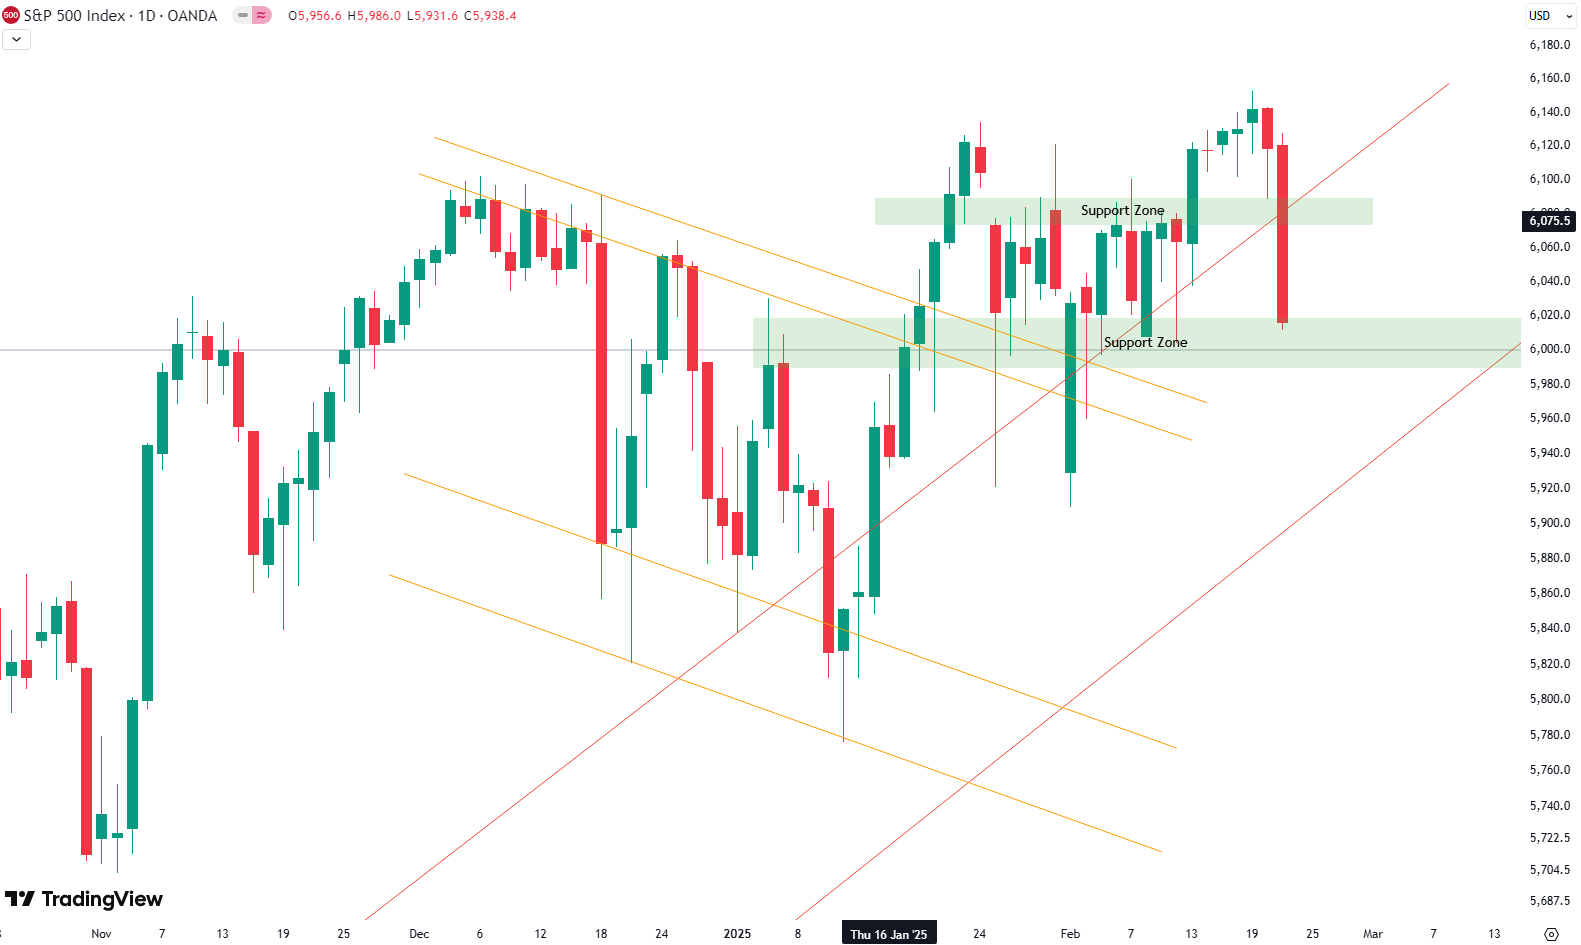
This week, the S&P 500 had another rollercoaster ride, ending with a 1.7% loss. Looking at the 4-hour chart, the market remained relatively stable for most of the week, moving sideways before a small drop on Thursday, a brief recovery, and a sharp sell-off on Friday. As seen in the chart, the green support zone…
-
Weekly Update S&P 500
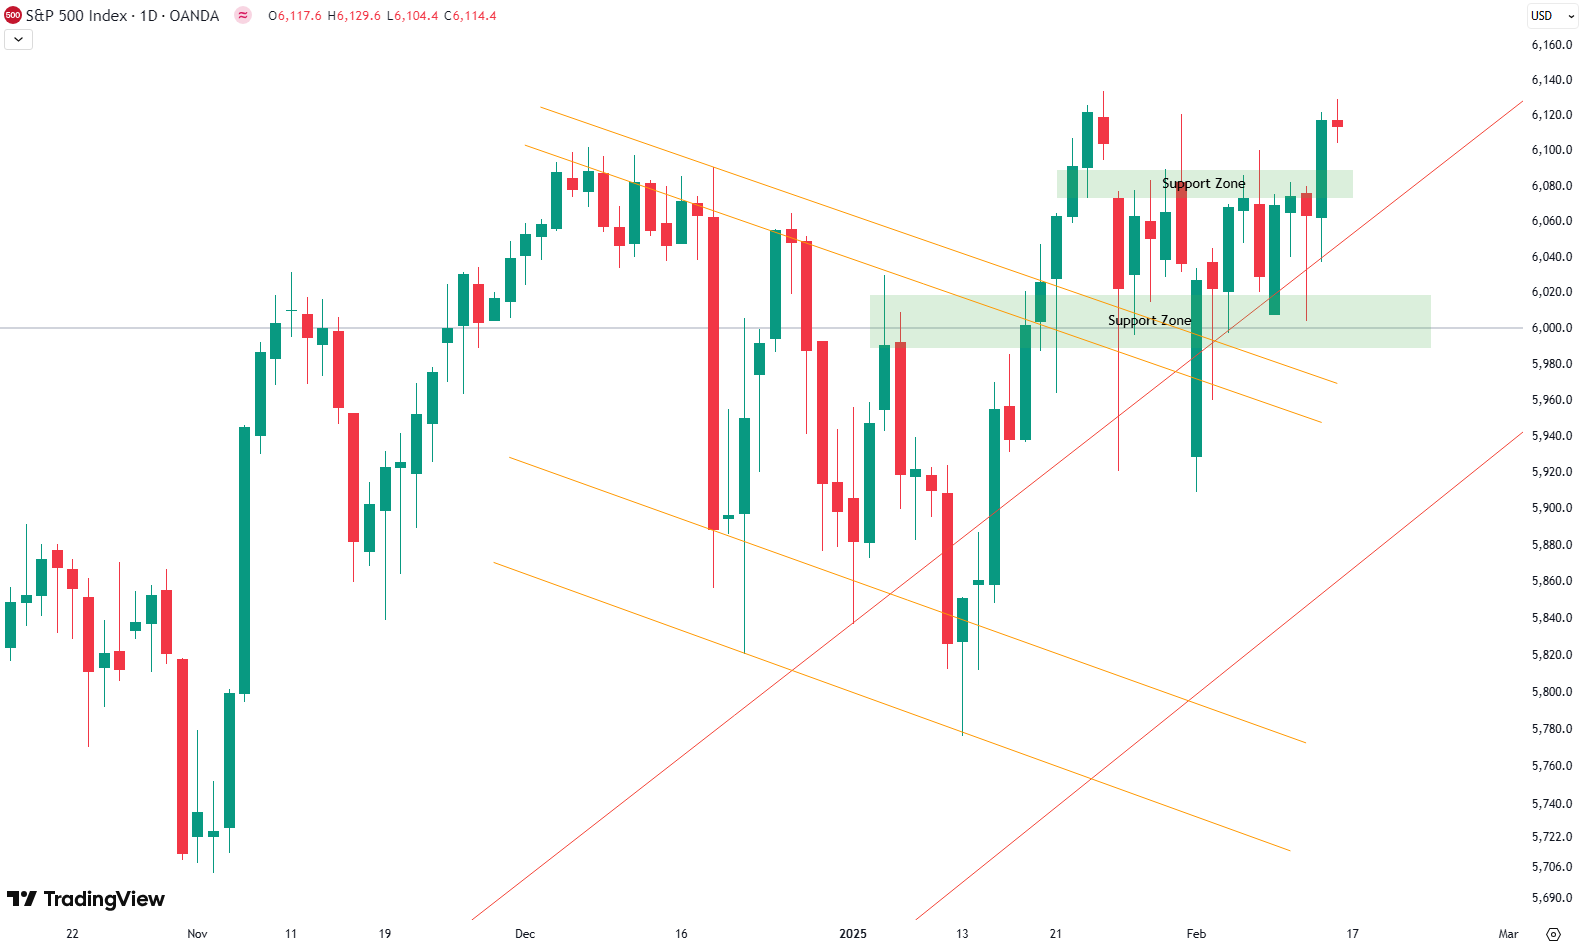
This week, the S&P 500 gained 1.5%, showing strength after weeks of consolidation. As seen in the chart, the 4-hour timeframe highlights increased volatility, with price swings in both directions. Instead of a clear correction to the downside, the market has been moving sideways, building a base around the 6,000-point mark, which has repeatedly acted…
-

Weekly Update S&P 500
Hello everyone! This week was another eventful one for the S&P 500. Looking at the 4-hour chart, we can see some major market movements. The week kicked off with a sharp drop of 1.8% at the open on Monday, meaning the market opened significantly lower than Friday’s close. However, what happened next was impressive: the…
-

Weekly Update S&P 500
Welcome to our weekly newsletter on the S&P 500. This week, the S&P 500 posted a loss of 1.1%. As shown in the 4‑hour chart covering the last couple of weeks, we saw a strong upward trend that suddenly met some turbulence. Over the weekend, new information emerged about China’s AI DeepSeek—a model that promises…