Tag: #Economy
-
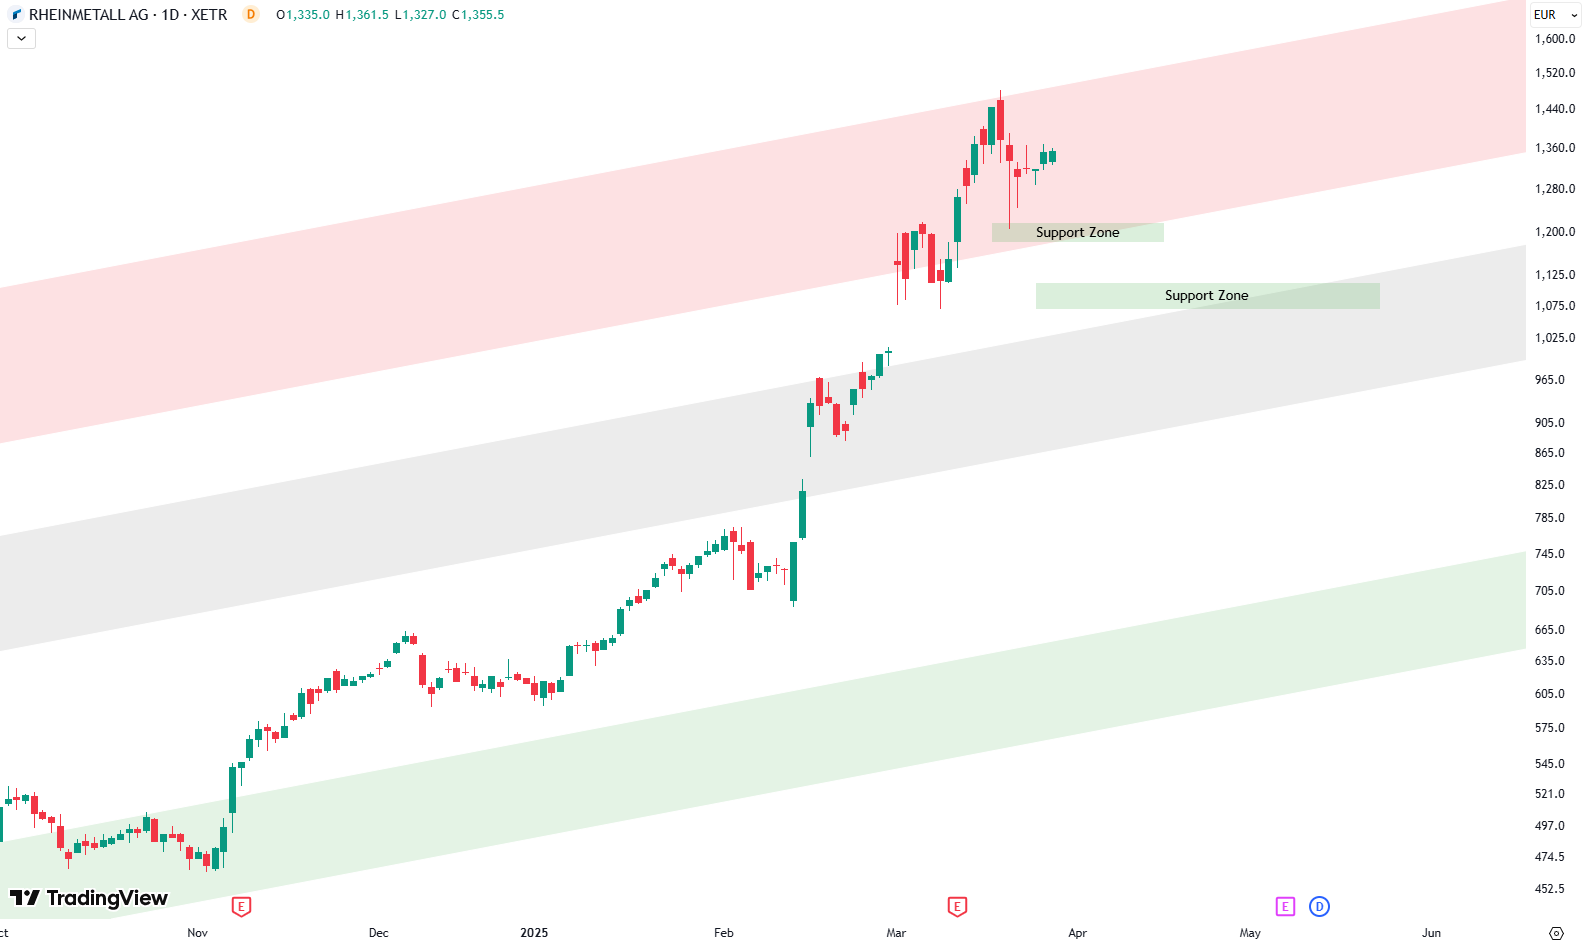
Is Rheinmetall hitting resistance?
Hello, everybody. This week, we’re taking a closer look at Rheinmetall, a leading European defense company that has seen incredible gains over the past few months—and, honestly, over the past couple of years. Since November 2024 alone, the stock has skyrocketed around 160%. That’s no small feat. Let’s break down what’s happening by diving into…
-
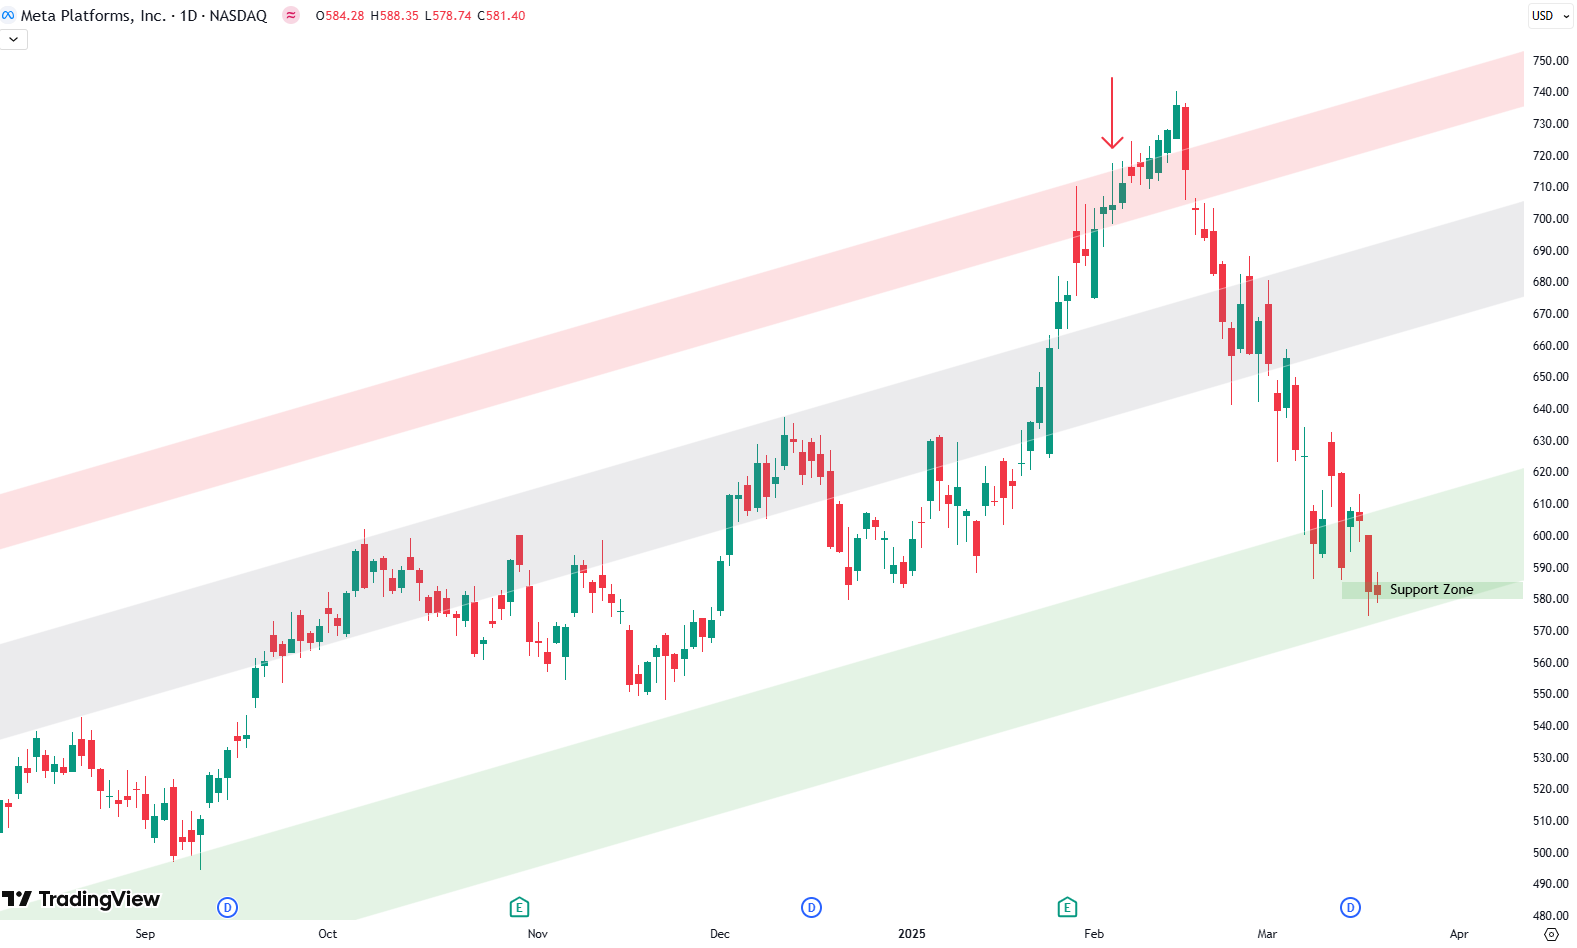
Is this the bottom for Meta?
This week, we’re taking a look at Meta, one of the biggest stocks in the S&P 500. The stock has been in a strong uptrend for quite some time, but things have taken a turn recently, making this a key moment to reassess its trajectory. A Well-Defined Uptrend – Until Now If you check out…
-
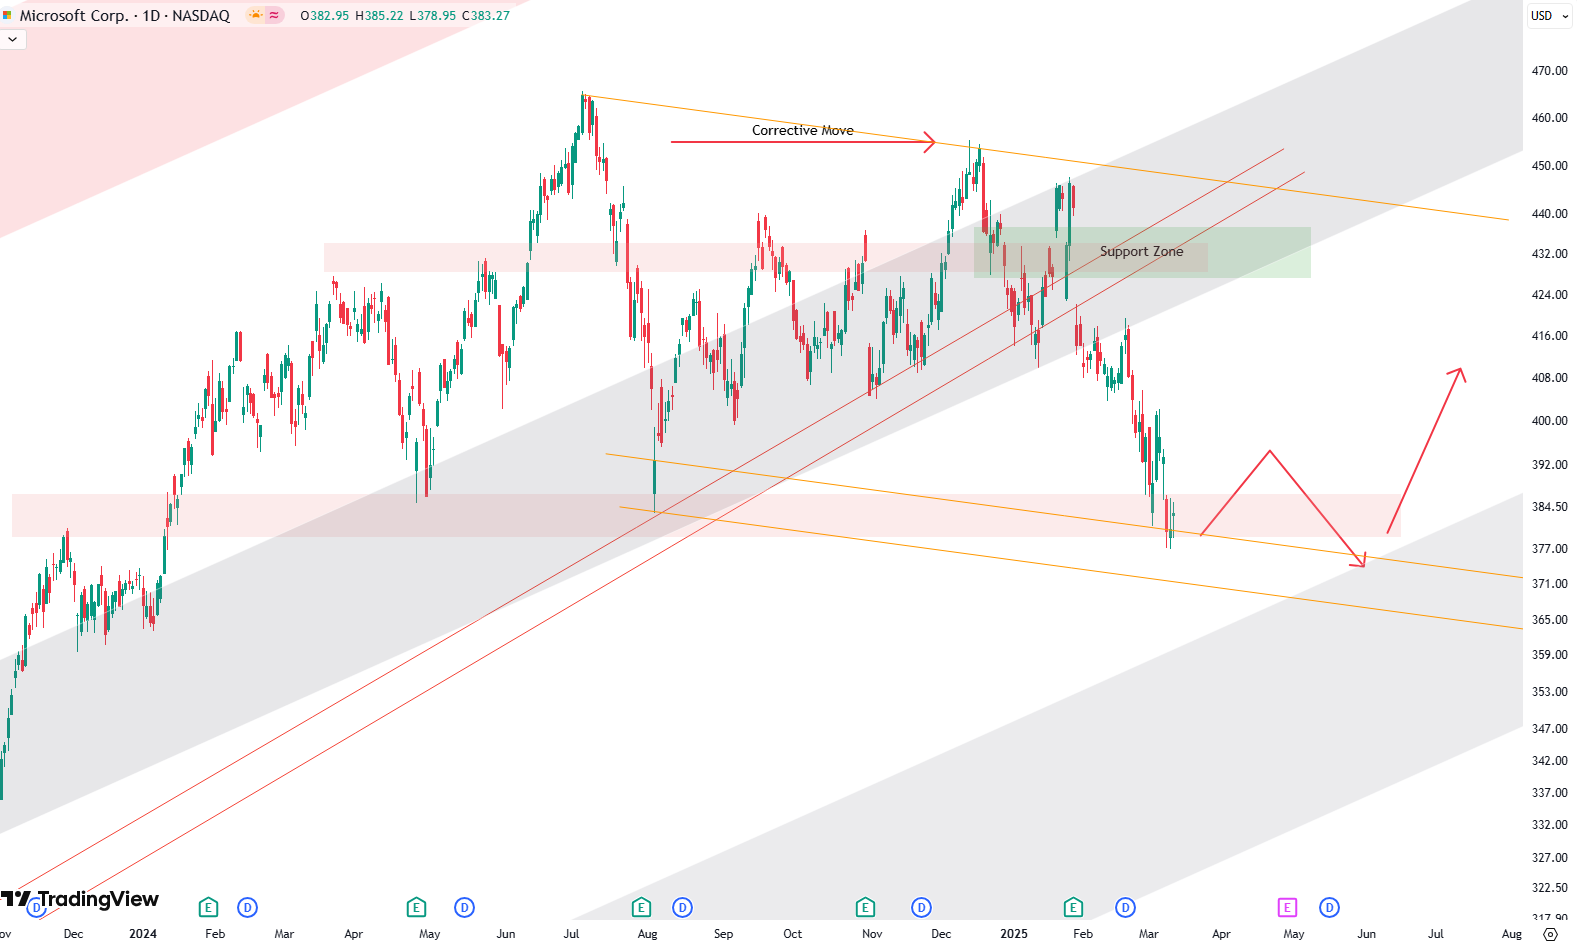
Microsoft Stock: Is This the Next Big Buying Opportunity?
Microsoft’s stock is currently at an interesting turning point, and if you’ve been following its journey, this could be a big moment. Let’s break it down in a way that makes sense, even if you’re just starting out with investing. Microsoft’s Long-Term Trend: Still on Track? Looking at the monthly chart, we see Microsoft has…
-
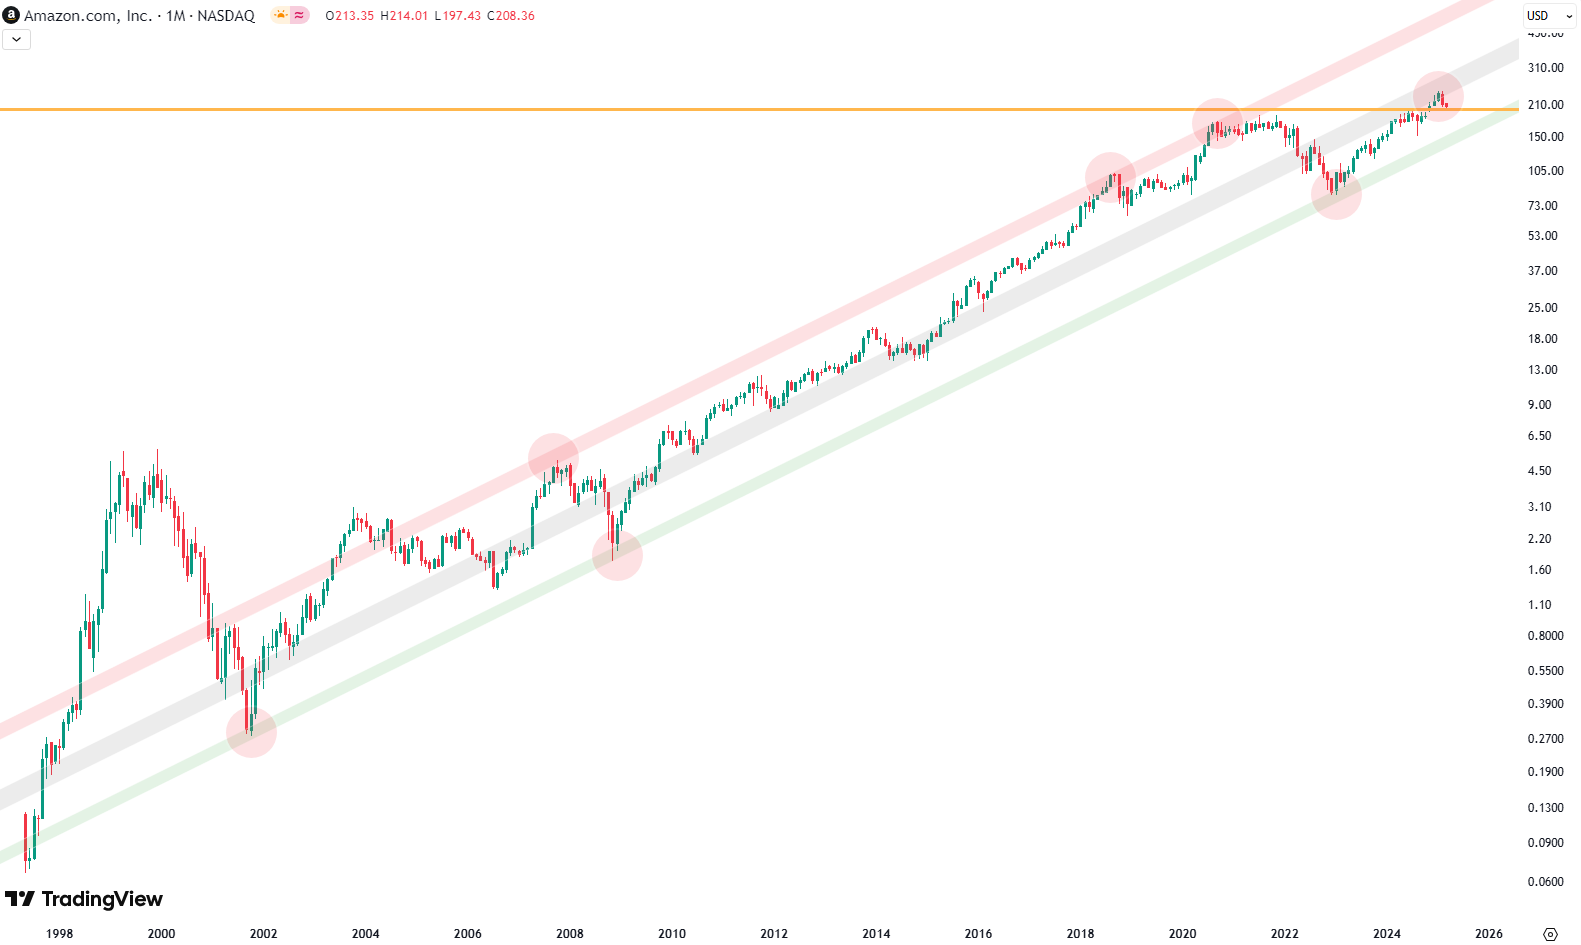
Amazon Hits Key Technical Level – Is It a Buy or a Warning Sign?
Amazon’s stock has been on a wild ride over the years, climbing steadily within a well-defined trend channel. If you look at the long-term chart, stretching all the way back to 1998, you’ll see a clear upward trajectory, with key support and resistance levels shaping its movement. One of the most important trendlines has been…
-
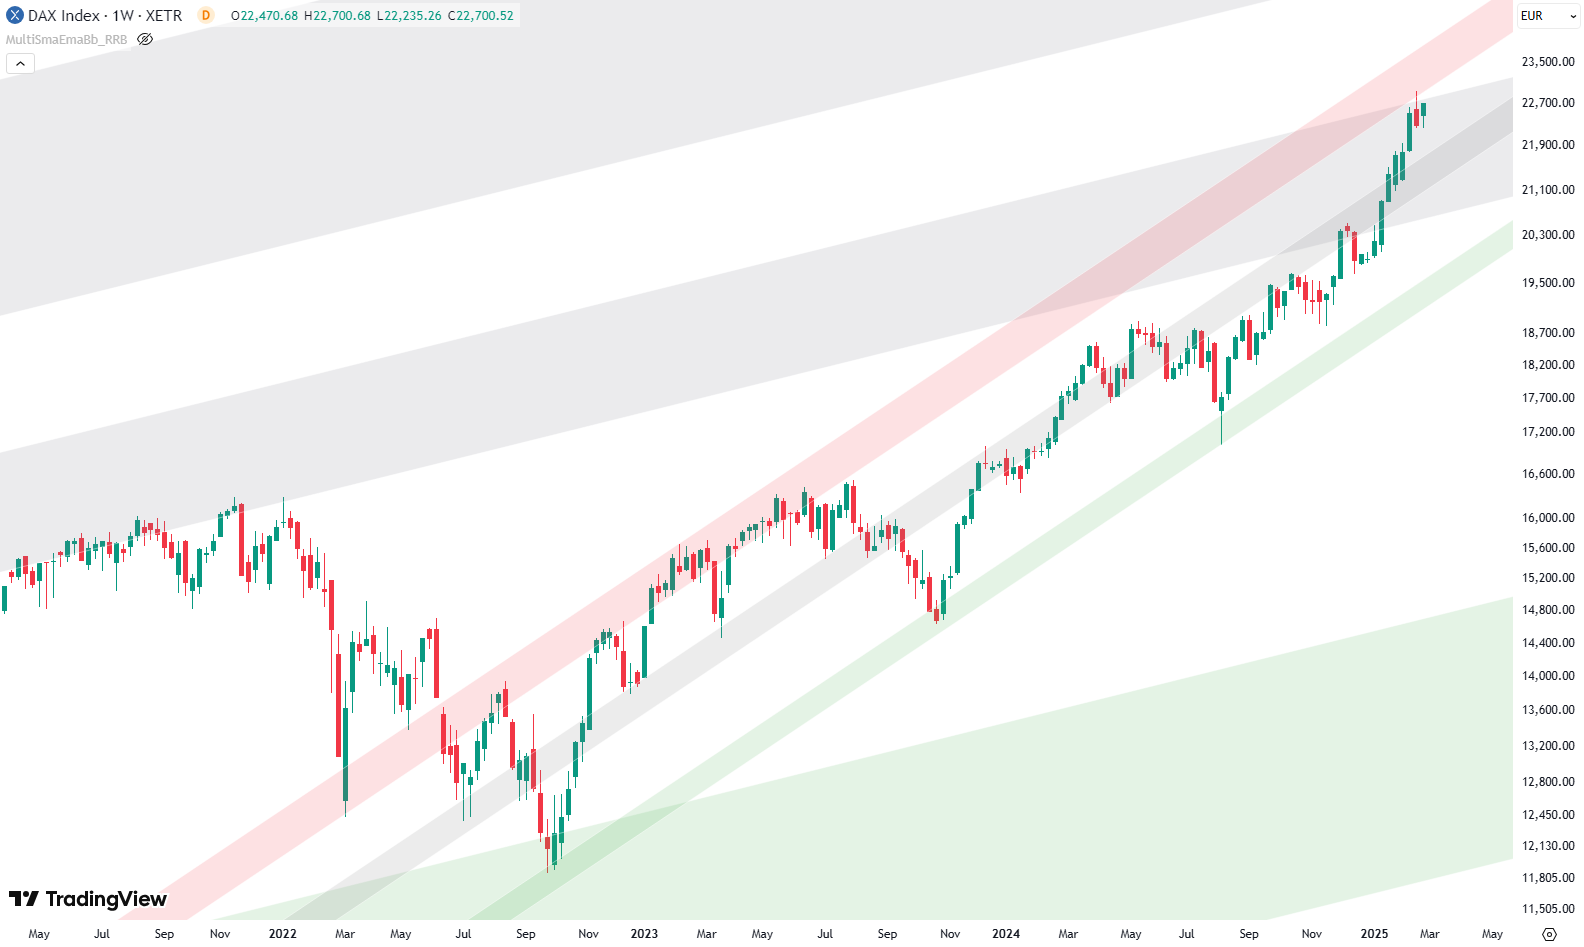
Has the DAX Reached Its Limit? A Chart Breakdown
Hello, everyone! This week, we’re diving into the DAX and its long-term trends. Looking at the quarterly chart, each candle represents three months, giving us a broad perspective all the way back to 1980. The trend is clear—DAX has been moving within a well-defined channel, respecting key support and resistance levels. The green shaded area…
-
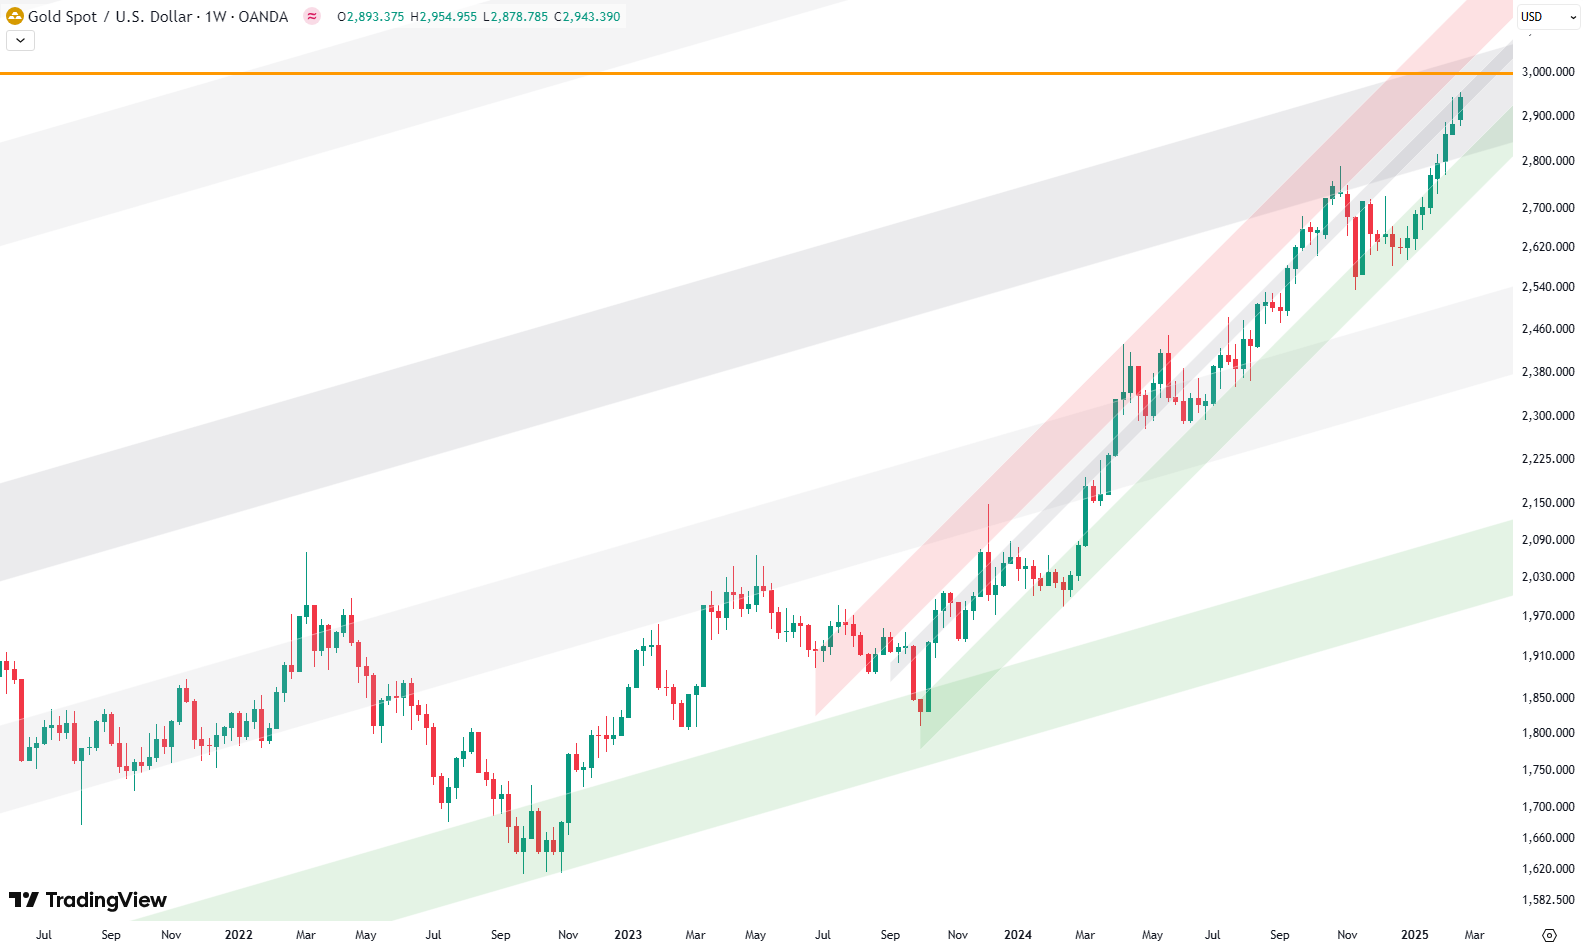
Will Gold Break $3,000 or Correct Soon?
Gold has been on an incredible run, and if you’ve been watching the charts, you know it’s been climbing steadily. But the big question now is: Can gold break the crucial $3,000 mark, or is a correction just around the corner? Gold’s Long-Term Climb – A Look at the Monthly Chart Taking a step back,…
-
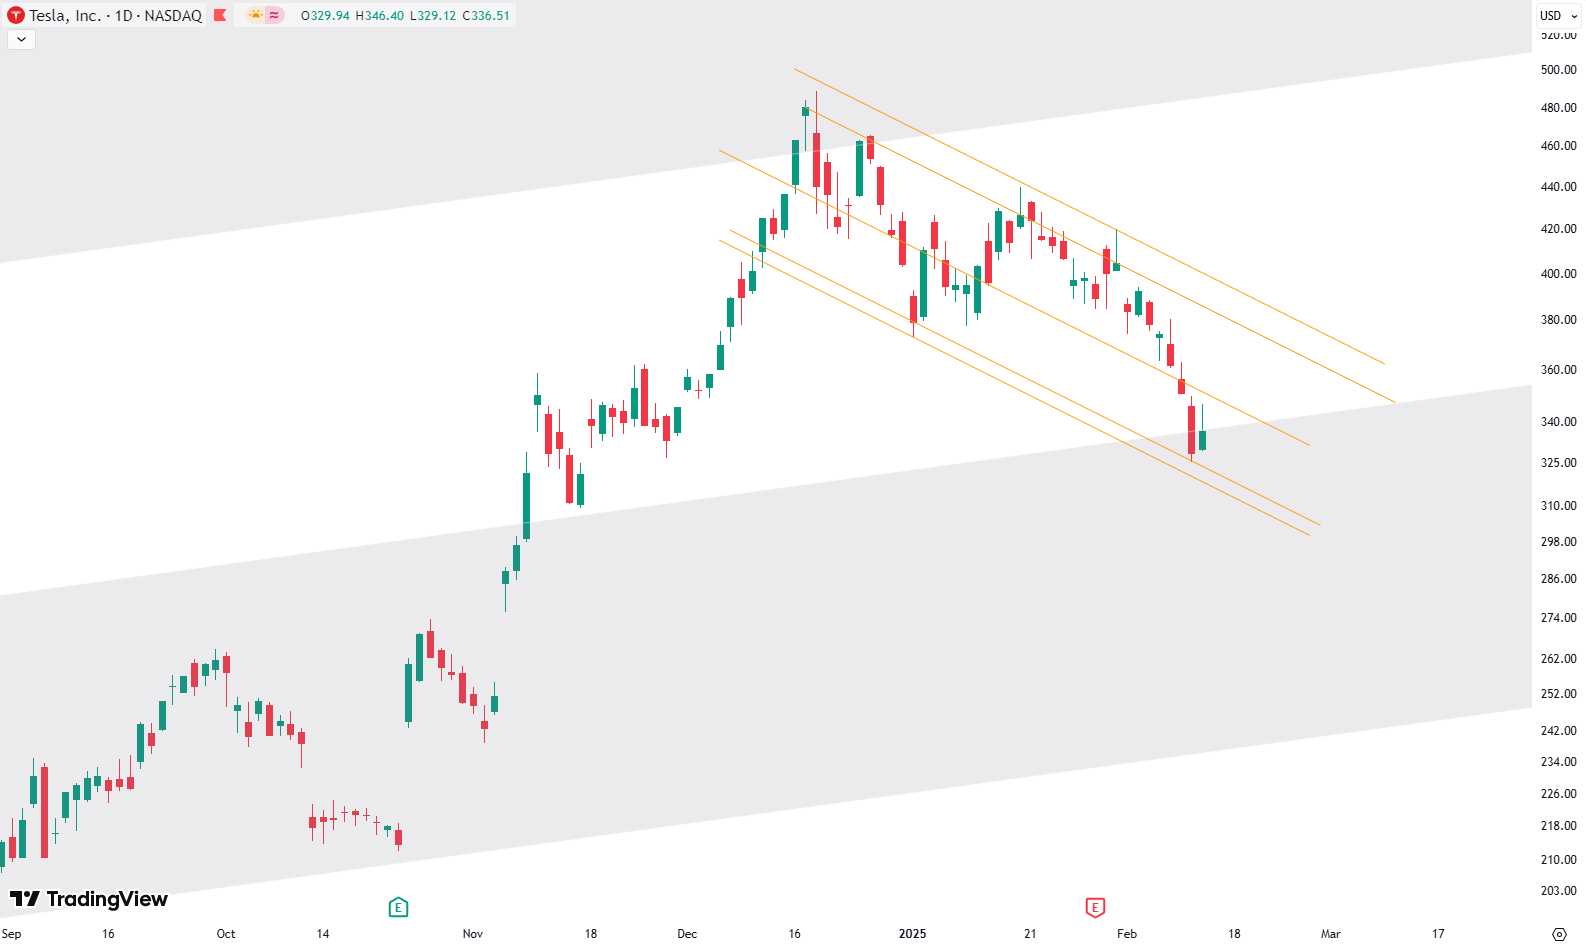
Tesla’s Recent Decline in Perspective: What the Charts Say
Tesla’s Stock Drop: A Healthy Correction or More Pain Ahead? Tesla’s recent decline has some investors worried, but let’s put it into perspective. Looking at the monthly chart, Tesla has been moving within a well-defined trend channel since 2011. This trend consists of multiple parallel support and resistance levels—green, gray, and red shaded areas—that have…
-
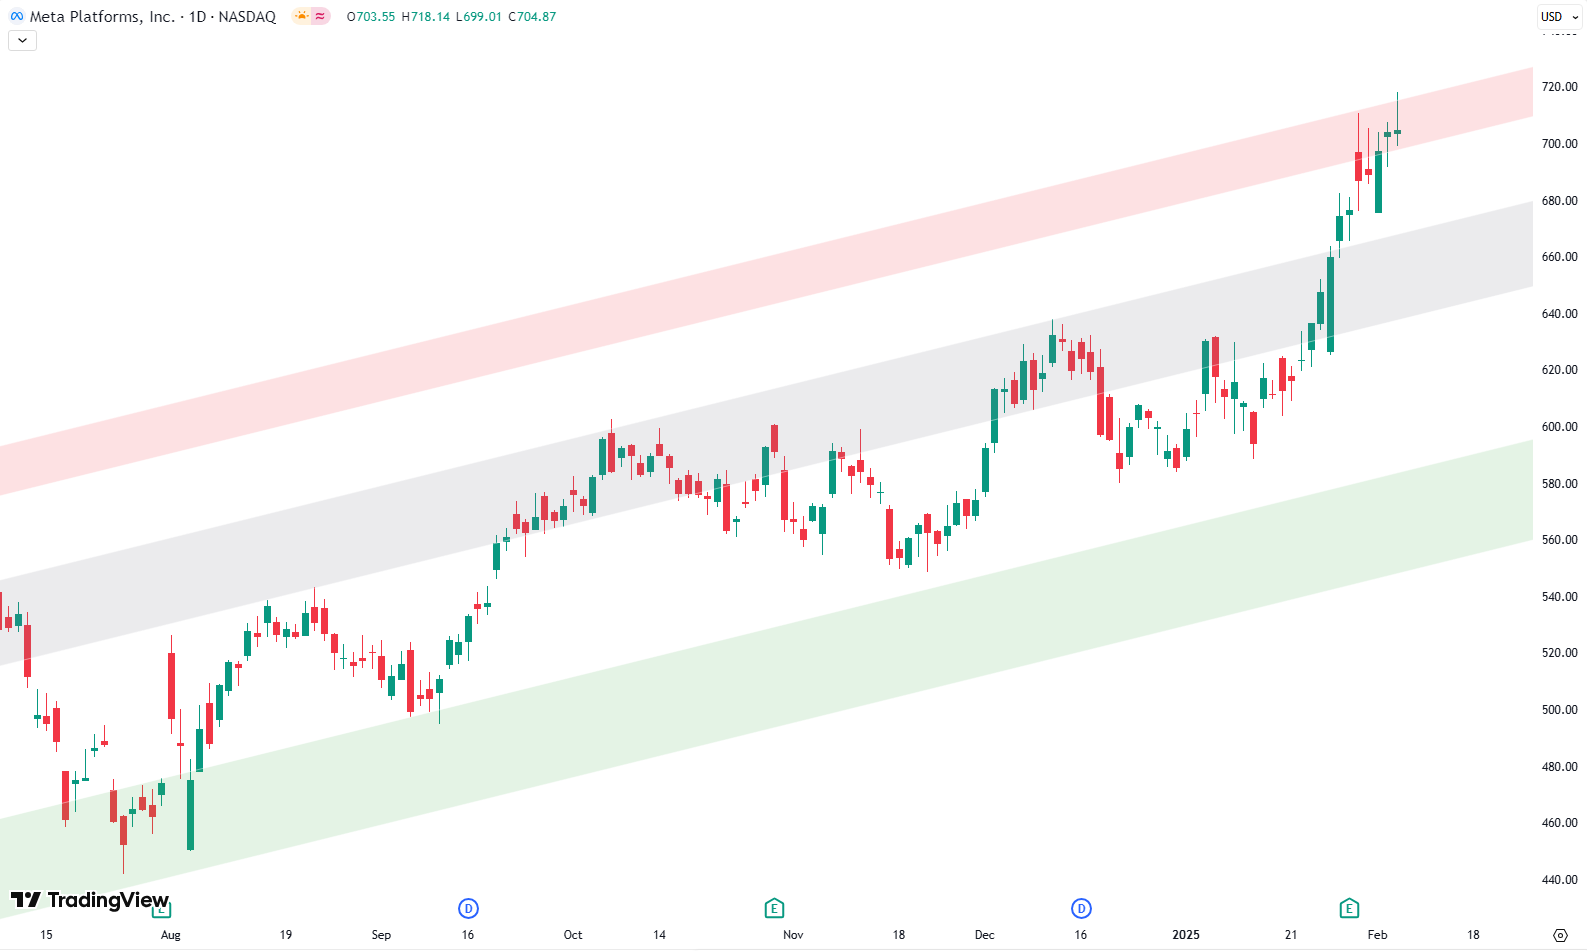
20% Gain in 2025 – Is It Time to Take Profits on Meta?
Meta Platforms, the parent company of Facebook, has been on a strong uptrend since early 2023. If you look at the weekly chart, you’ll notice a well-defined rising trend channel with three key zones: the green support area at the bottom, the gray balance area in the middle, and the red resistance zone at the…
-
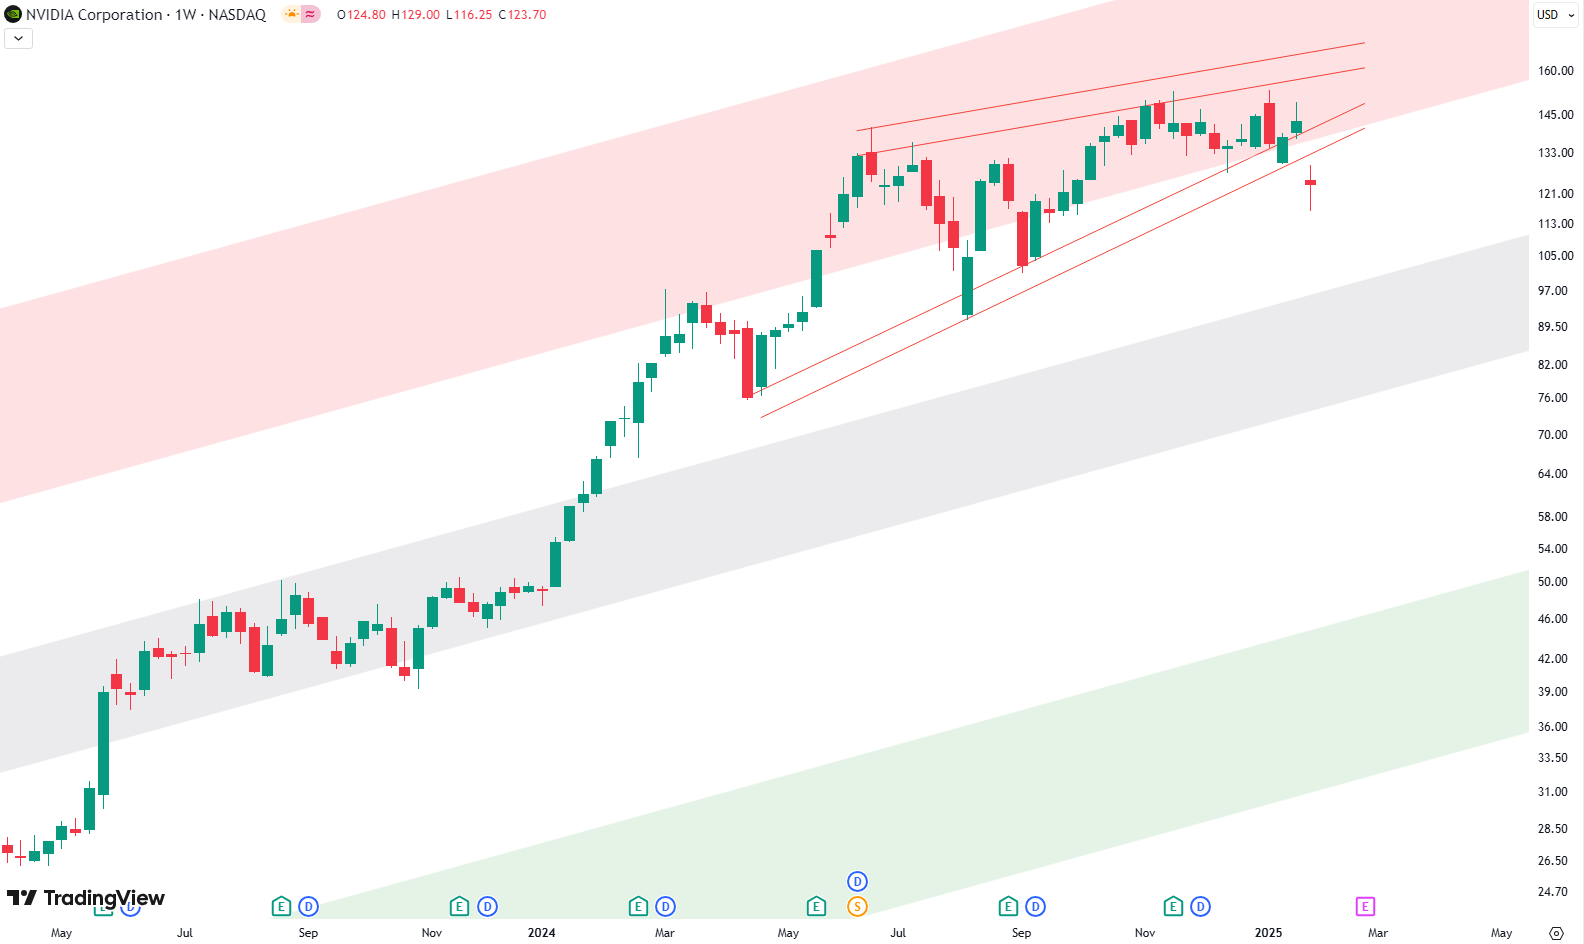
Bearish Patterns Take Over NVIDIA’s Chart
This week, NVIDIA is making headlines, and not just because of its impressive run in the stock market. A shock from China has raised some big questions about the company’s future. A new AI model, DeepSeek, has entered the scene and is reportedly delivering results comparable to other AI, but at a much lower cost.…
-

Is This the Healthcare Sector’s Next Bullish Move?
Understanding XLV’s Long-Term Picture When it comes to analyzing the Healthcare sector in the S&P 500, XLV is in the spotlight. Let’s start with the long-term chart—each candle here represents one month, spanning all the way from 2008 to today. What makes this chart fascinating is the clear, upward-rising trend channel, marked by green support…