Schlagwort: #Microsoft
-

S&P 500 Monthly Chart Turns Bearish
Hello everybody. This week, we’ll take a look at the long-term picture on the S&P 500, starting with the monthly chart, which goes back to 2020. We’re focusing on this because a major technical indicator has recently been triggered—the monthly MACD. A Sell Signal from the Monthly MACD The MACD, or Moving Average Convergence Divergence,…
-

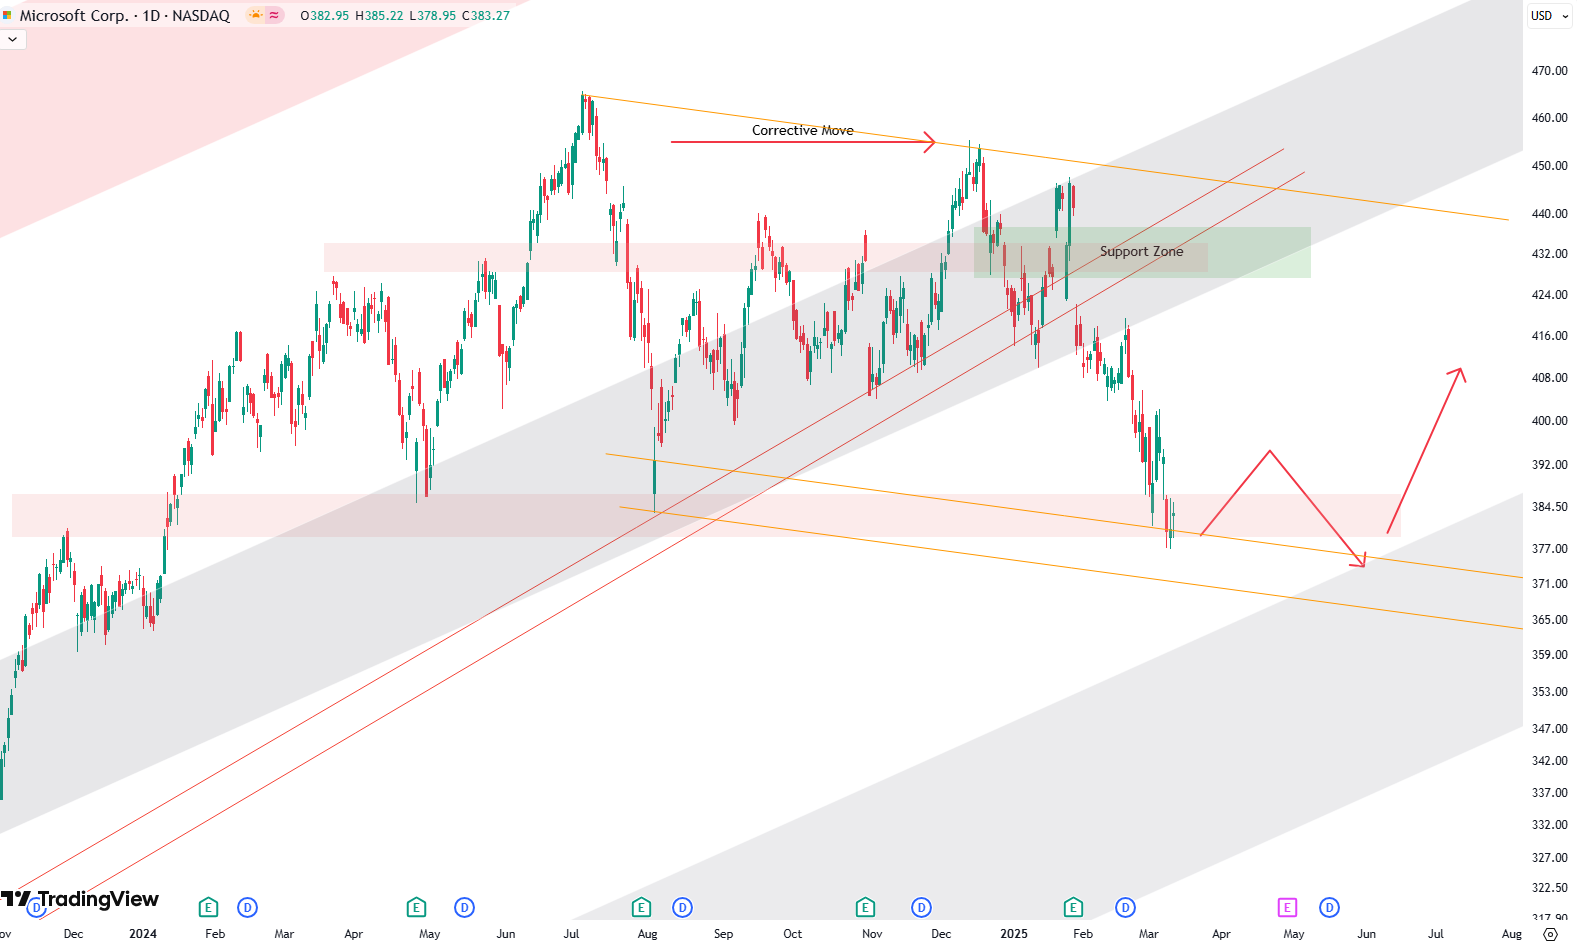
Is Microsoft Due for a Pullback? The Charts Suggest So
This week, we’re revisiting Microsoft with a fresh look at both the weekly and daily charts. For context, we first published this chart setup back in March. It’s the same long-term view that stretches all the way back to 2020—nothing changed structurally, just updated with current price action. This trend structure dates back to 2020.…
-
Microsoft Stock: Is This the Next Big Buying Opportunity?
Microsoft’s stock is currently at an interesting turning point, and if you’ve been following its journey, this could be a big moment. Let’s break it down in a way that makes sense, even if you’re just starting out with investing. Microsoft’s Long-Term Trend: Still on Track? Looking at the monthly chart, we see Microsoft has…
-

Analyzing 100 Years of the S&P 500: A Technical Perspective
When it comes to understanding the S&P 500 on a long-term scale, there’s nothing quite like zooming out. By looking at a yearly chart, where each candle represents one year of market movement, we gain valuable perspective. Spanning more than 100 years, this approach offers clarity about where we stand today while letting us analyze…
-

Critical Support Zone for Microsoft
Microsoft has been underperforming the broader market, including the S&P 500, since July. The trouble began with a sharp 17% drop in July—a steep and impulsive move downward that set the stage for the months that followed. Since then, Microsoft has risen again, but the upward movement has been slow and marked by overlapping wave…