Kategorie: Asset of the week
-
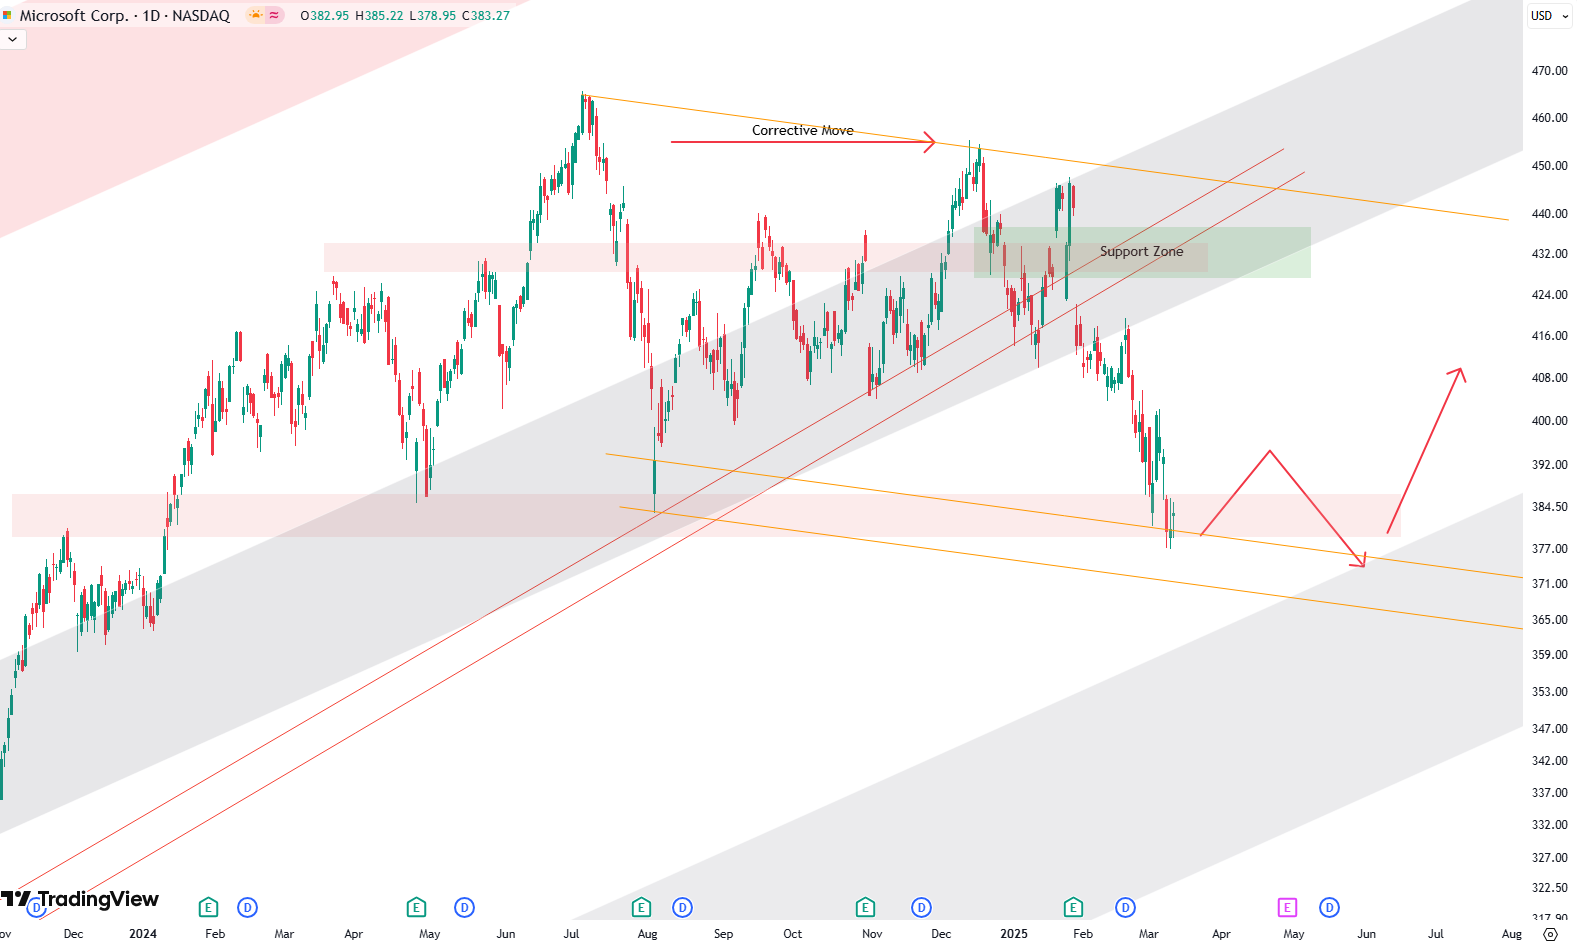
Microsoft Stock: Is This the Next Big Buying Opportunity?
Microsoft’s stock is currently at an interesting turning point, and if you’ve been following its journey, this could be a big moment. Let’s break it down in a way that makes sense, even if you’re just starting out with investing. Microsoft’s Long-Term Trend: Still on Track? Looking at the monthly chart, we see Microsoft has…
-
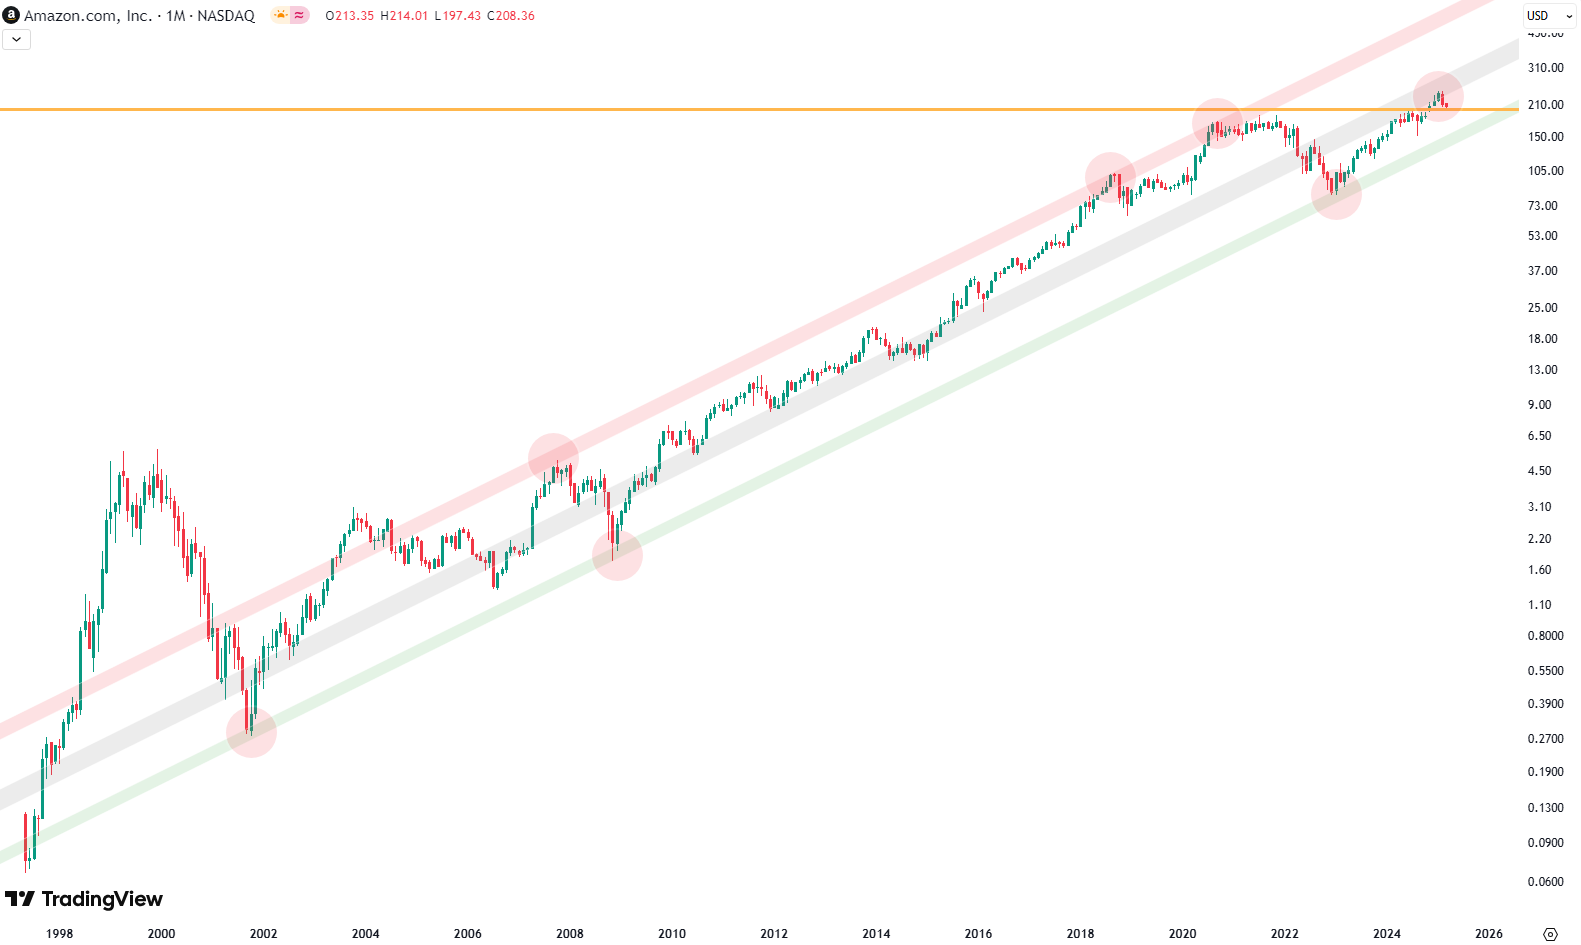
Amazon Hits Key Technical Level – Is It a Buy or a Warning Sign?
Amazon’s stock has been on a wild ride over the years, climbing steadily within a well-defined trend channel. If you look at the long-term chart, stretching all the way back to 1998, you’ll see a clear upward trajectory, with key support and resistance levels shaping its movement. One of the most important trendlines has been…
-
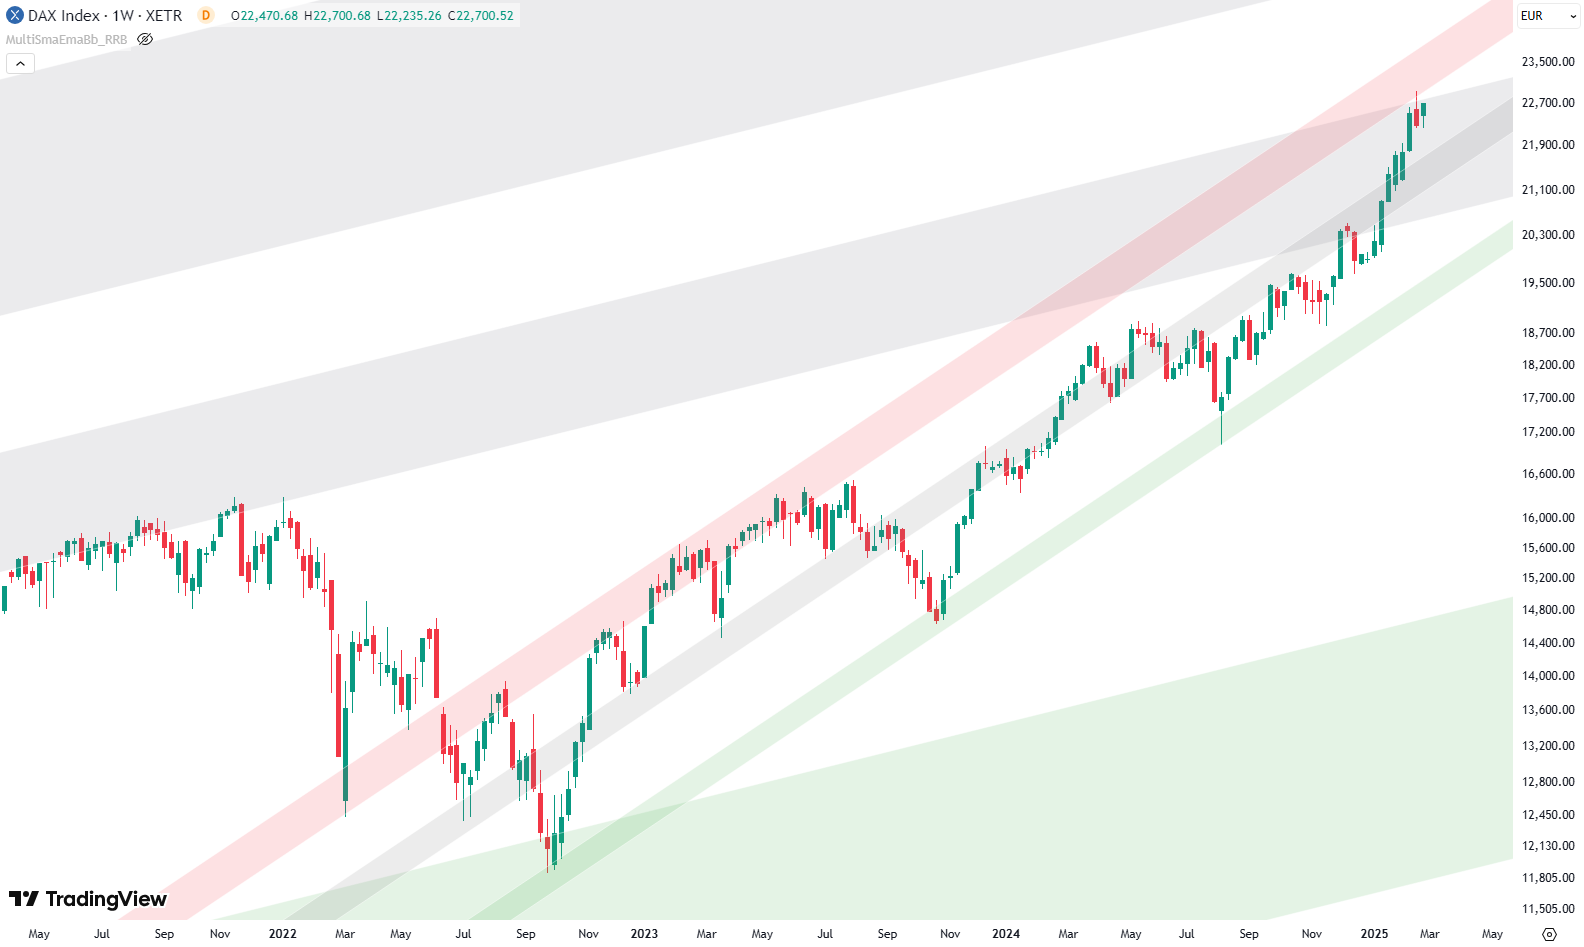
Has the DAX Reached Its Limit? A Chart Breakdown
Hello, everyone! This week, we’re diving into the DAX and its long-term trends. Looking at the quarterly chart, each candle represents three months, giving us a broad perspective all the way back to 1980. The trend is clear—DAX has been moving within a well-defined channel, respecting key support and resistance levels. The green shaded area…
-
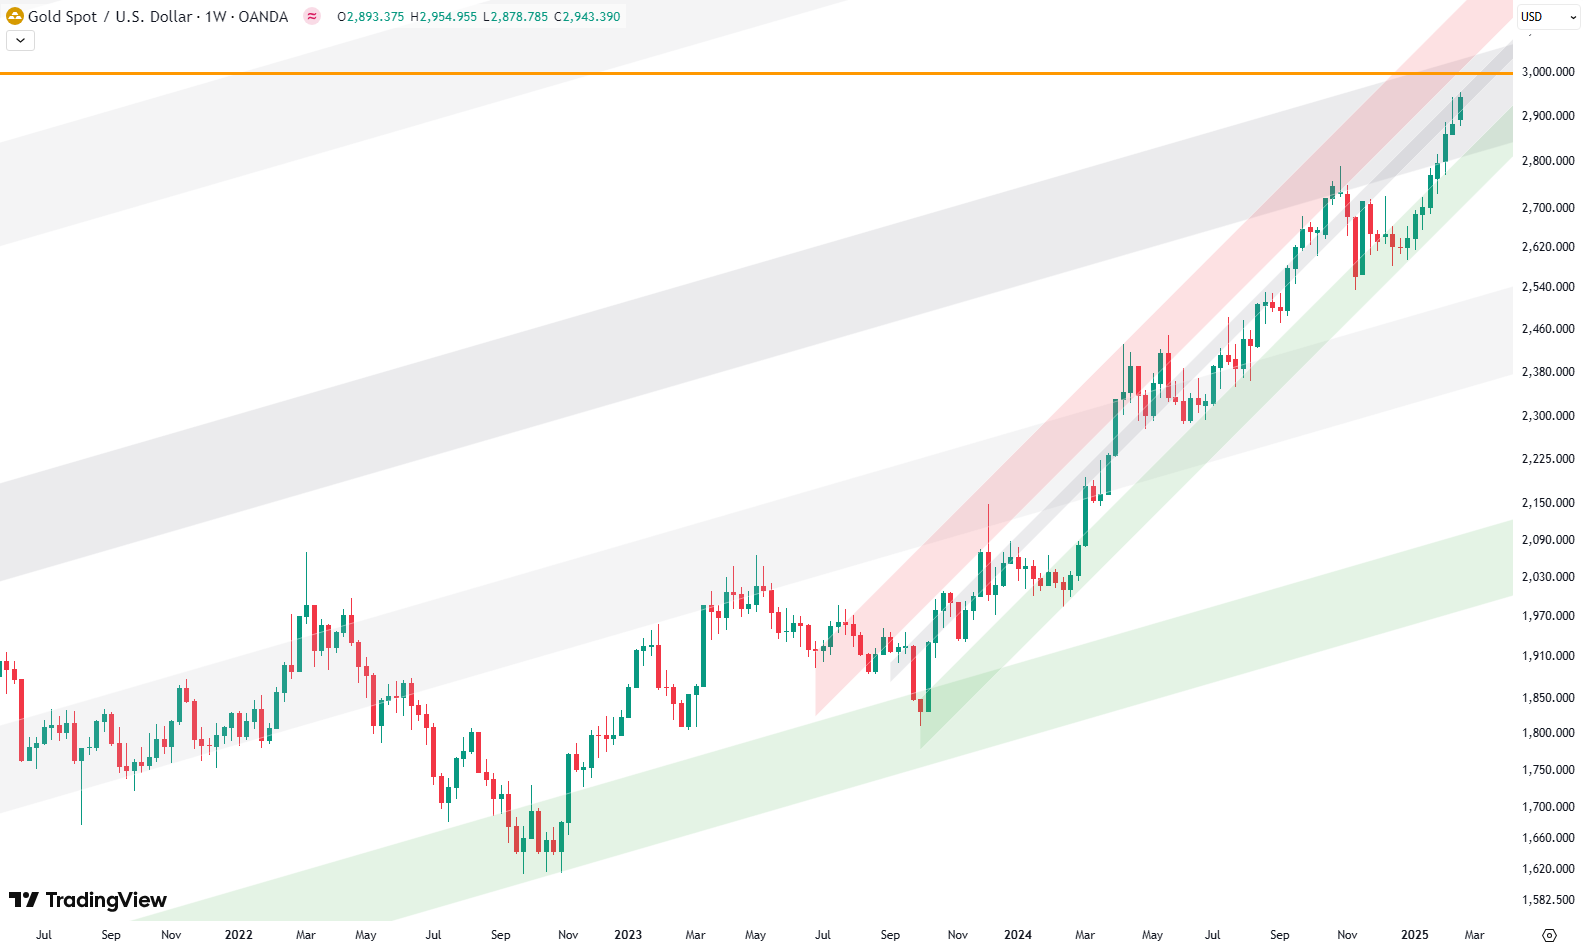
Will Gold Break $3,000 or Correct Soon?
Gold has been on an incredible run, and if you’ve been watching the charts, you know it’s been climbing steadily. But the big question now is: Can gold break the crucial $3,000 mark, or is a correction just around the corner? Gold’s Long-Term Climb – A Look at the Monthly Chart Taking a step back,…
-
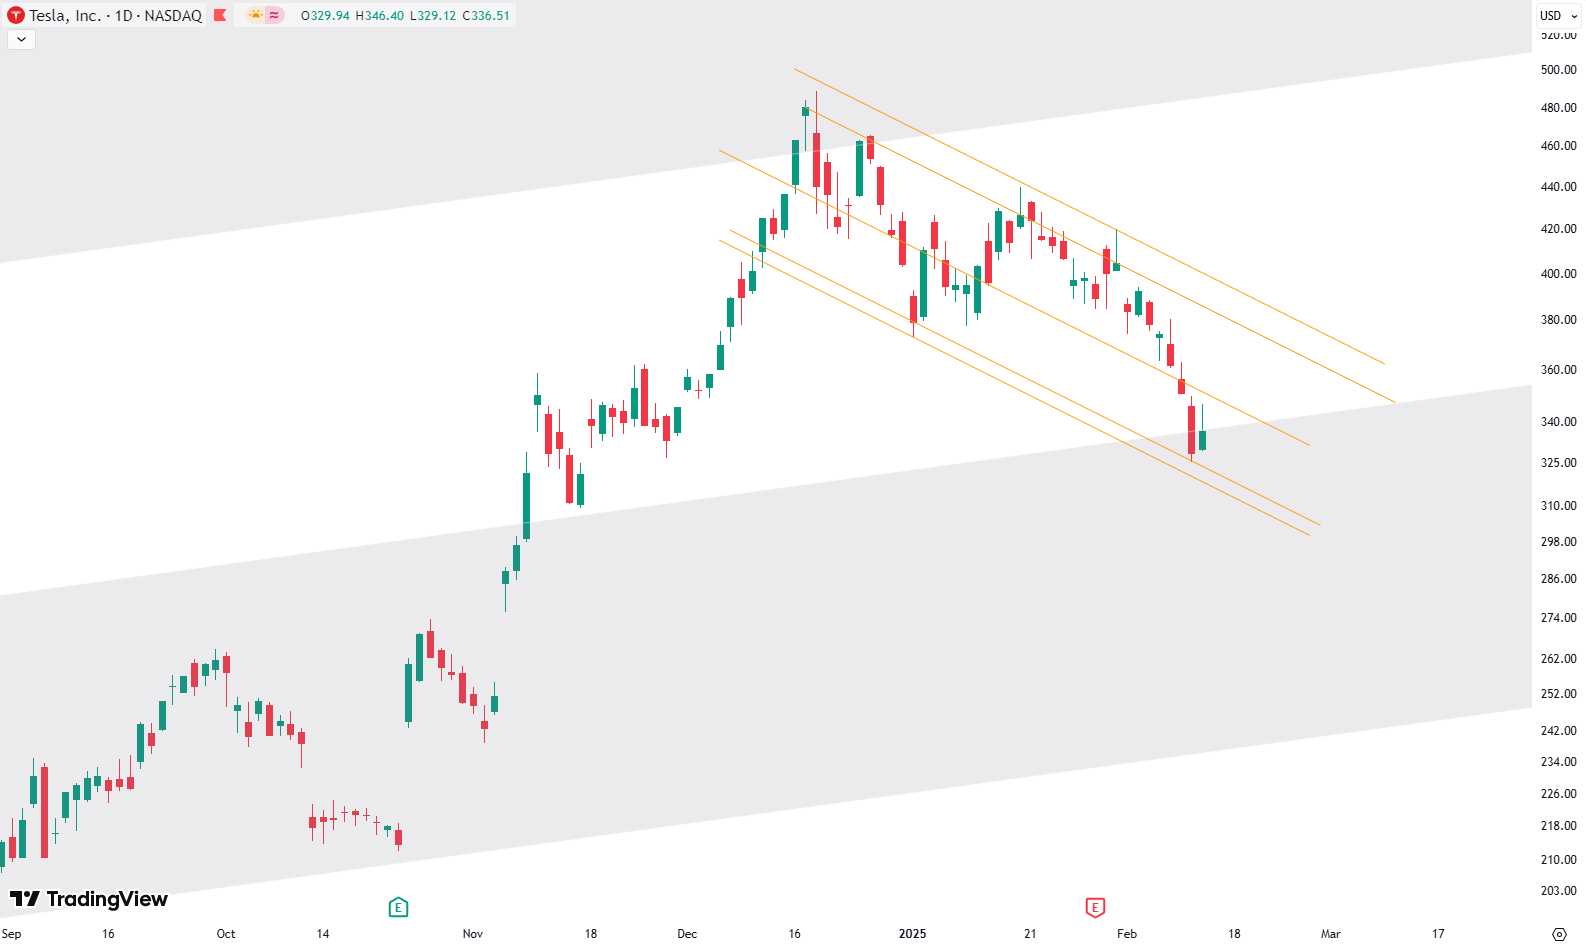
Tesla’s Recent Decline in Perspective: What the Charts Say
Tesla’s Stock Drop: A Healthy Correction or More Pain Ahead? Tesla’s recent decline has some investors worried, but let’s put it into perspective. Looking at the monthly chart, Tesla has been moving within a well-defined trend channel since 2011. This trend consists of multiple parallel support and resistance levels—green, gray, and red shaded areas—that have…
-
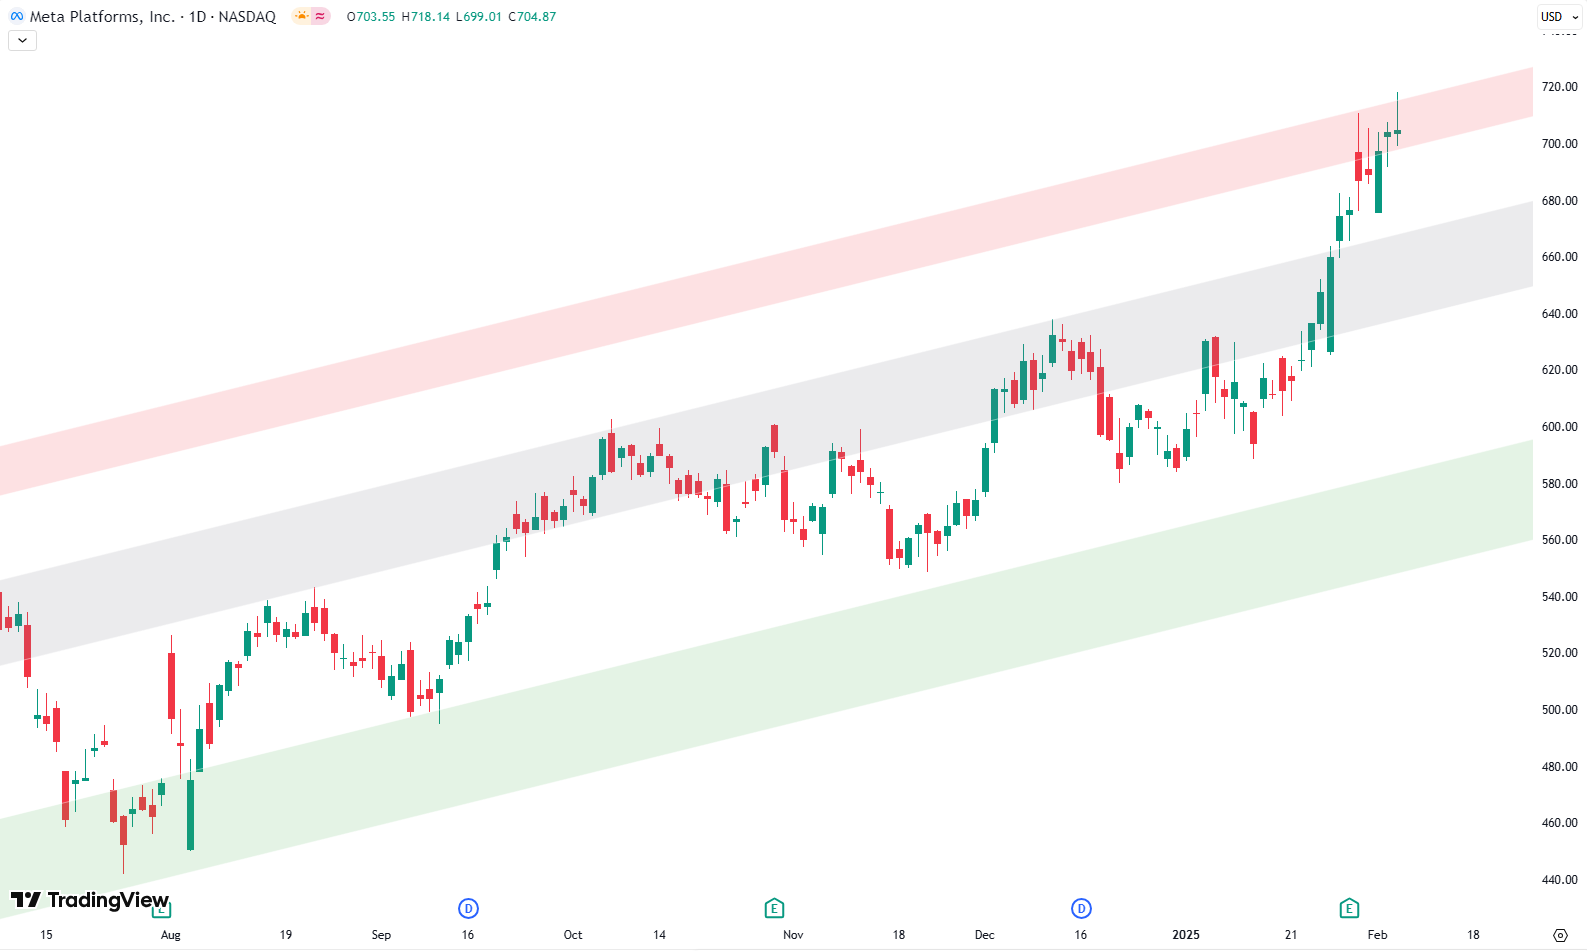
20% Gain in 2025 – Is It Time to Take Profits on Meta?
Meta Platforms, the parent company of Facebook, has been on a strong uptrend since early 2023. If you look at the weekly chart, you’ll notice a well-defined rising trend channel with three key zones: the green support area at the bottom, the gray balance area in the middle, and the red resistance zone at the…
-
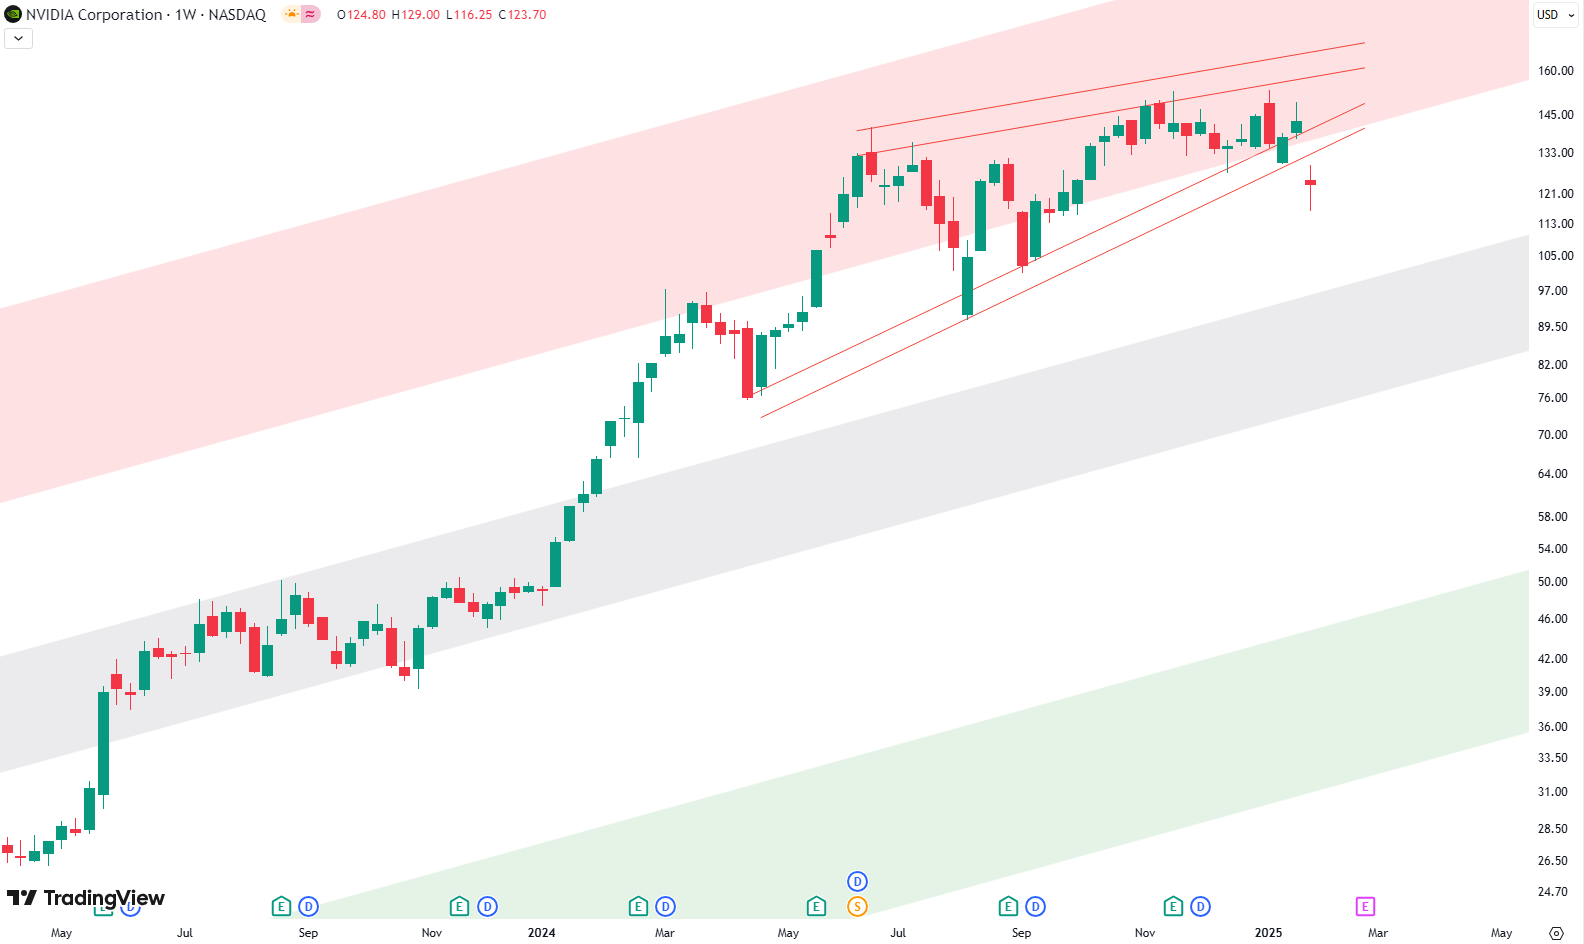
Bearish Patterns Take Over NVIDIA’s Chart
This week, NVIDIA is making headlines, and not just because of its impressive run in the stock market. A shock from China has raised some big questions about the company’s future. A new AI model, DeepSeek, has entered the scene and is reportedly delivering results comparable to other AI, but at a much lower cost.…
-

Is This the Healthcare Sector’s Next Bullish Move?
Understanding XLV’s Long-Term Picture When it comes to analyzing the Healthcare sector in the S&P 500, XLV is in the spotlight. Let’s start with the long-term chart—each candle here represents one month, spanning all the way from 2008 to today. What makes this chart fascinating is the clear, upward-rising trend channel, marked by green support…
-

Technical Breakdown of GDX: Testing Resistance Levels
The gold miner ETF (GDX) has been moving within a well-established trend channel since 2015. Let’s break down the charts to understand where it might head next. Monthly Chart: The Big Picture Since 2015 Looking at GDX’s monthly chart, we see a steady upward trend channel framed by a green area at the bottom (support),…
-

T-Mobile: A 15-Year Trendline Analysis
This week, we’re diving into T-Mobile’s stock with an interesting chart that dates back to 2009. This chart uses a logarithmic scale, showcasing a clear and steady trend channel defined by three parallel trendlines: the green line at the bottom, the grey line in the middle, and the red line at the top. Each line…