Autor: Daniel
-

Wie tief wird Gold fallen?
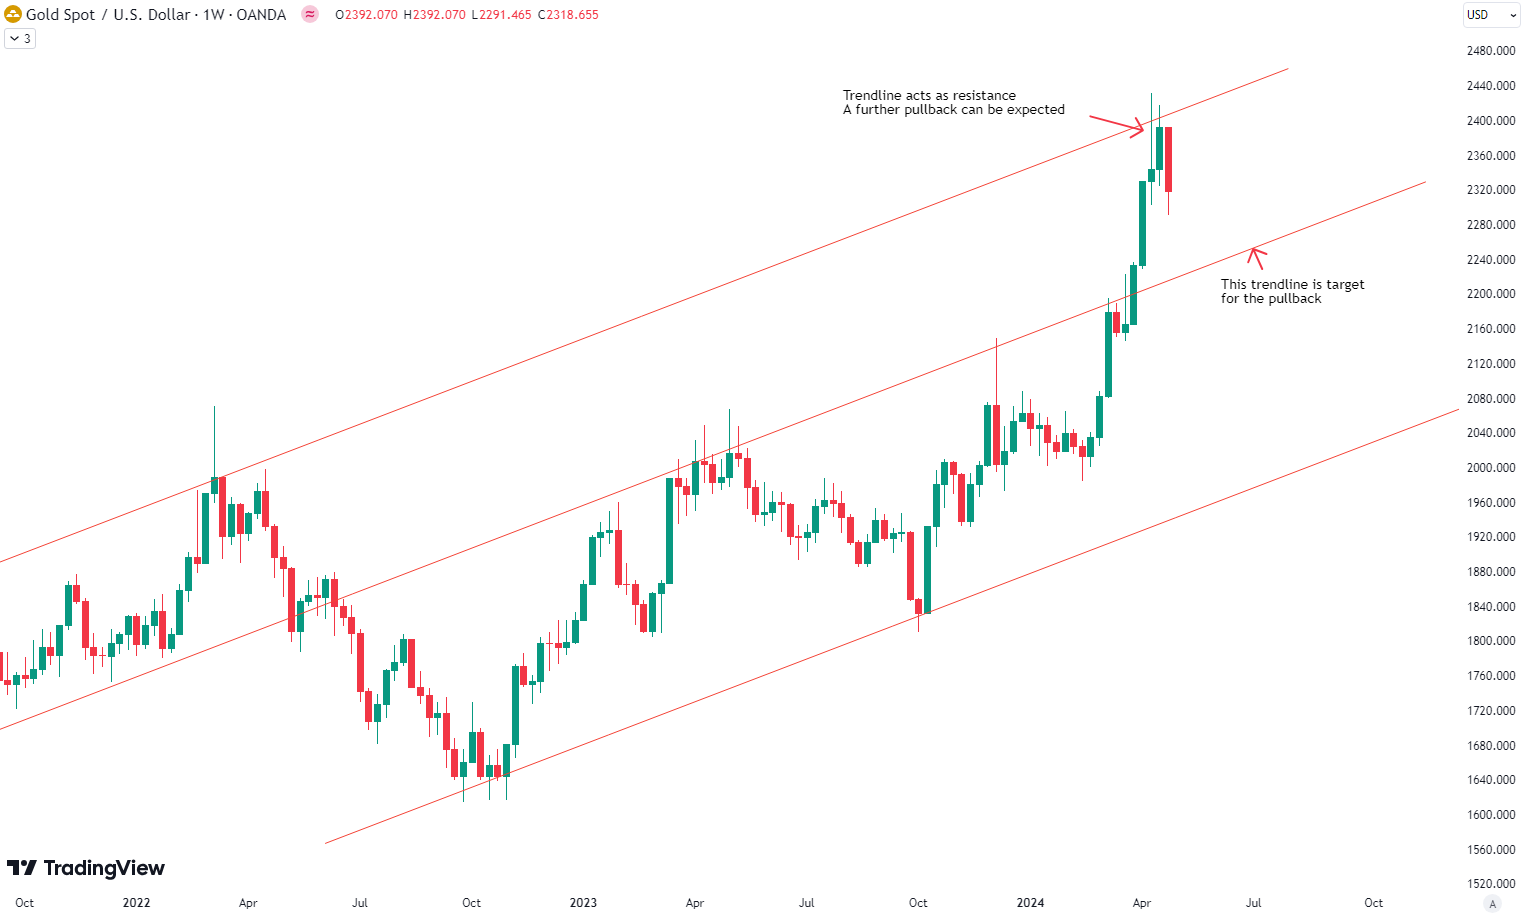
In this week’s post, we will take a close look at gold, which has been making headlines due to its strong performance in recent weeks. Looking at a weekly chart of Gold since 2022, we can observe a well-established trend channel on a weekly basis, indicating a sustained uptrend. Gold experienced a notable upward move…
-

Wöchentliches Update
This week, the S&P 500 experienced a significant loss of 3.1%, reflecting a notable decline in market value. The downward movement accelerated throughout the week, indicating heightened selling pressure. On the 1-hour time frame, a new downtrend (shown in gray) has been established, as illustrated in the chart. This downtrend suggests a shift in market…
-

Wöchentliches Update
Last week, the S&P 500 recorded a loss of -1.6%. There was noticeable increased volatility in the market. The ups and downs throughout the week reflected investors’ uncertainty. Despite occasional periods of recovery, the downtrend continued. This sustained weakness could be attributed to still elevated inflation numbers coming from the US. Our last position, which…
-

Wöchentliches Update
Last week, the S&P 500 recorded a loss of -0.8%, with particularly significant losses observed on Thursday. This marked the first time in a long while that a week ended with a downtrend. Investors are closely monitoring this development as it may signal a shift in market sentiment. Our last position, which we placed, has…
-

Wöchentliches Update
Last week, the S&P 500 recorded a gain of +0.3%, characterized by slight losses as the index moved below a trendline and corrected over several days. On Wednesday, the S&P 500 was able to break out of the downtrend with a strong rally. Our last position, which we placed, has been active since February 16th.…
-

Wöchentliches Update
Last week, the S&P 500 recorded a gain of +2.2%, marked by consistent increases, as well as a particularly strong rally on Wednesday following the FOMC Meeting of the FED. In the meeting, the FED signaled interest rate cuts as expected throughout the year. However, the positive momentum for the markets came from the announcement…
-

Wöchentliches Update
Last week, the S&P 500 experienced a slight decline of -0.2%, characterized by a rally on Tuesday and a sell-off on Friday. Since the beginning of March, the S&P 500 has been moving within a tightening trend channel. However, on Friday, the S&P 500 broke downward out of this formation. This development has caused uncertainty…
-

Wöchentliches Update
Last week, the S&P 500 experienced a slight decline of -0.04%, characterized by a sell-off on Tuesday and a rally on Thursday. Over the past two weeks, the S&P 500 has been moving within a tightening trend channel. Although the release of US labor market data briefly caused the index to break out of this…
-

Wöchentliches Update
The S&P 500 moved by +0.88% this week. From Monday to Wednesday, the index traded within a trend channel, from which it broke out on Thursday. The sideways movement has reduced the short-term overbought condition, providing some upward potential for the S&P 500. On Friday, February 16th, our indicators signaled, triggering a new trading signal.…
-

Risk Level Indicator 25.02.2024
Last Signal Since 20.11.2023: Risk Level 1 (Blue) The macro environment remains negative, with various signals from the RLI increasingly confirming this. My base case scenario is for rising prices until a recession in the USA or a credit event (credit crunch) in the spring of 2024. Especially noteworthy is the BTFP (Bank Term Funding…