Autor: Daniel
-
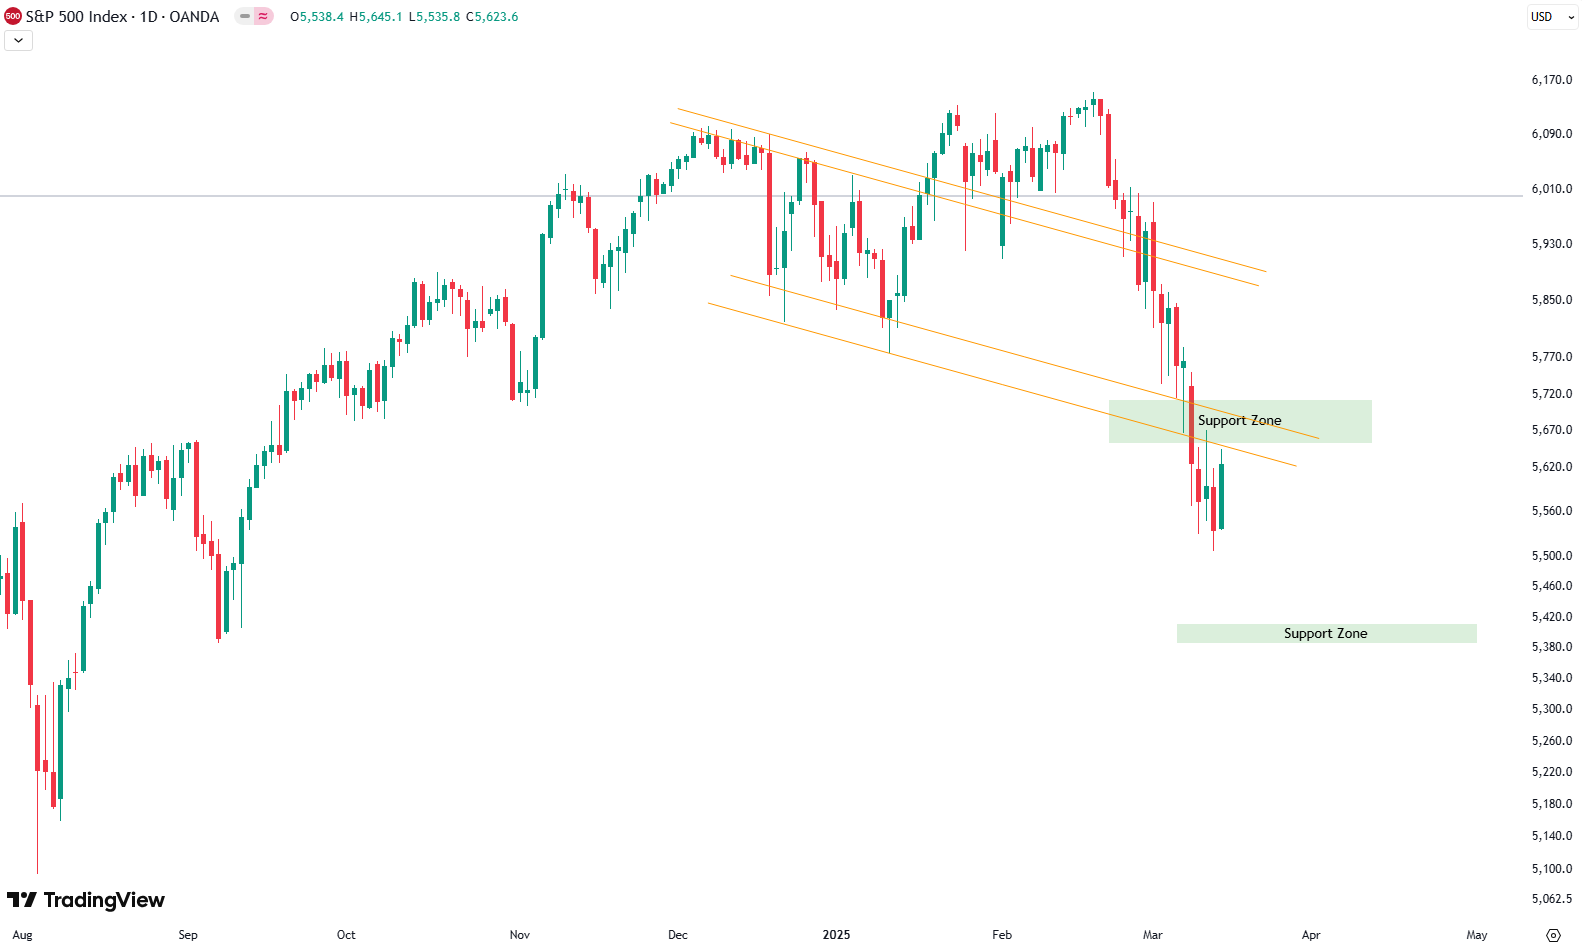
Wöchentliches Update S&P 500
Welcome to our weekly newsletter on the S&P 500! This week was a rough one for the S&P 500, with the index losing 2.5% overall. Monday’s dramatic drop of nearly 3% set the tone, followed by choppy movement on Tuesday and Wednesday, another dip on Thursday, and some recovery on Friday. Looking at the 4-hour…
-
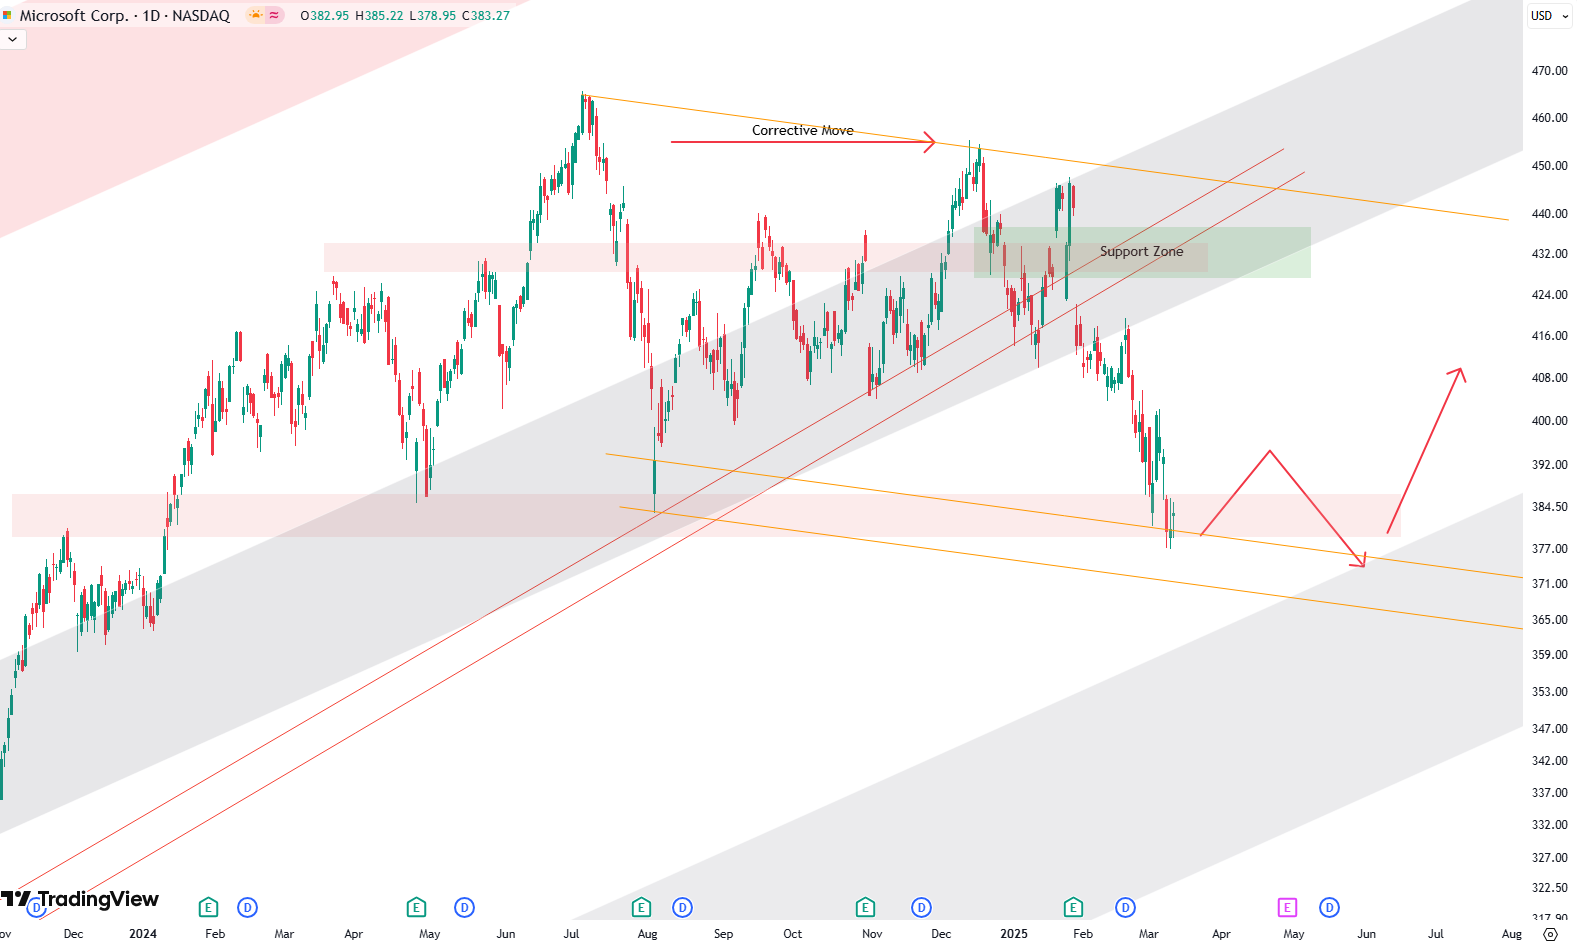
Microsoft Stock: Is This the Next Big Buying Opportunity?
Microsoft’s stock is currently at an interesting turning point, and if you’ve been following its journey, this could be a big moment. Let’s break it down in a way that makes sense, even if you’re just starting out with investing. Microsoft’s Long-Term Trend: Still on Track? Looking at the monthly chart, we see Microsoft has…
-
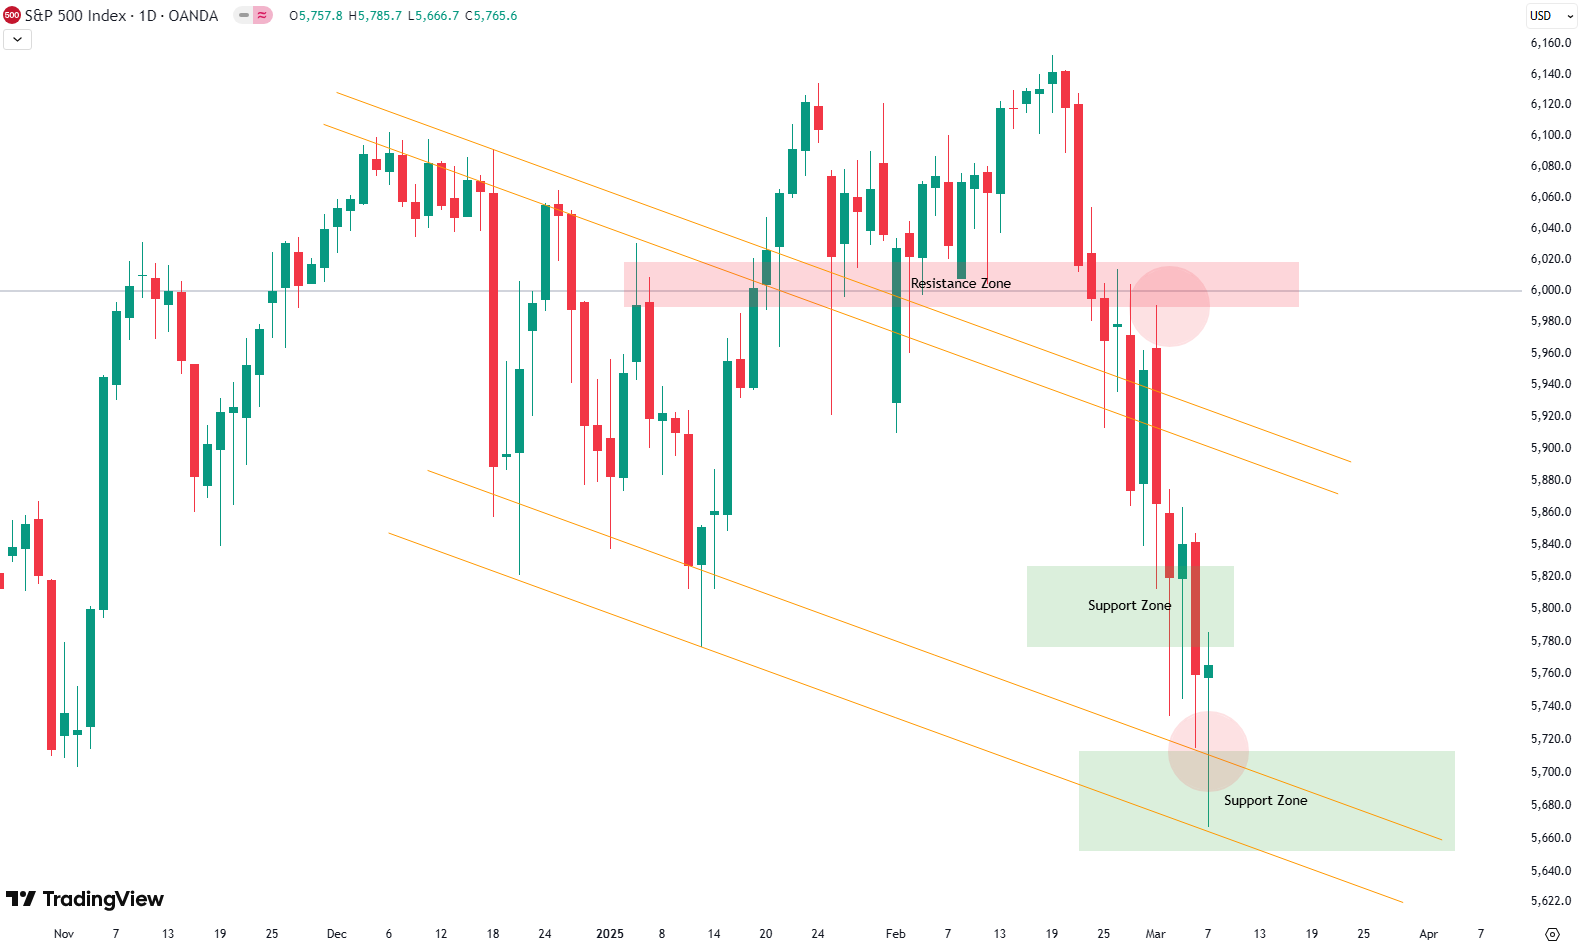
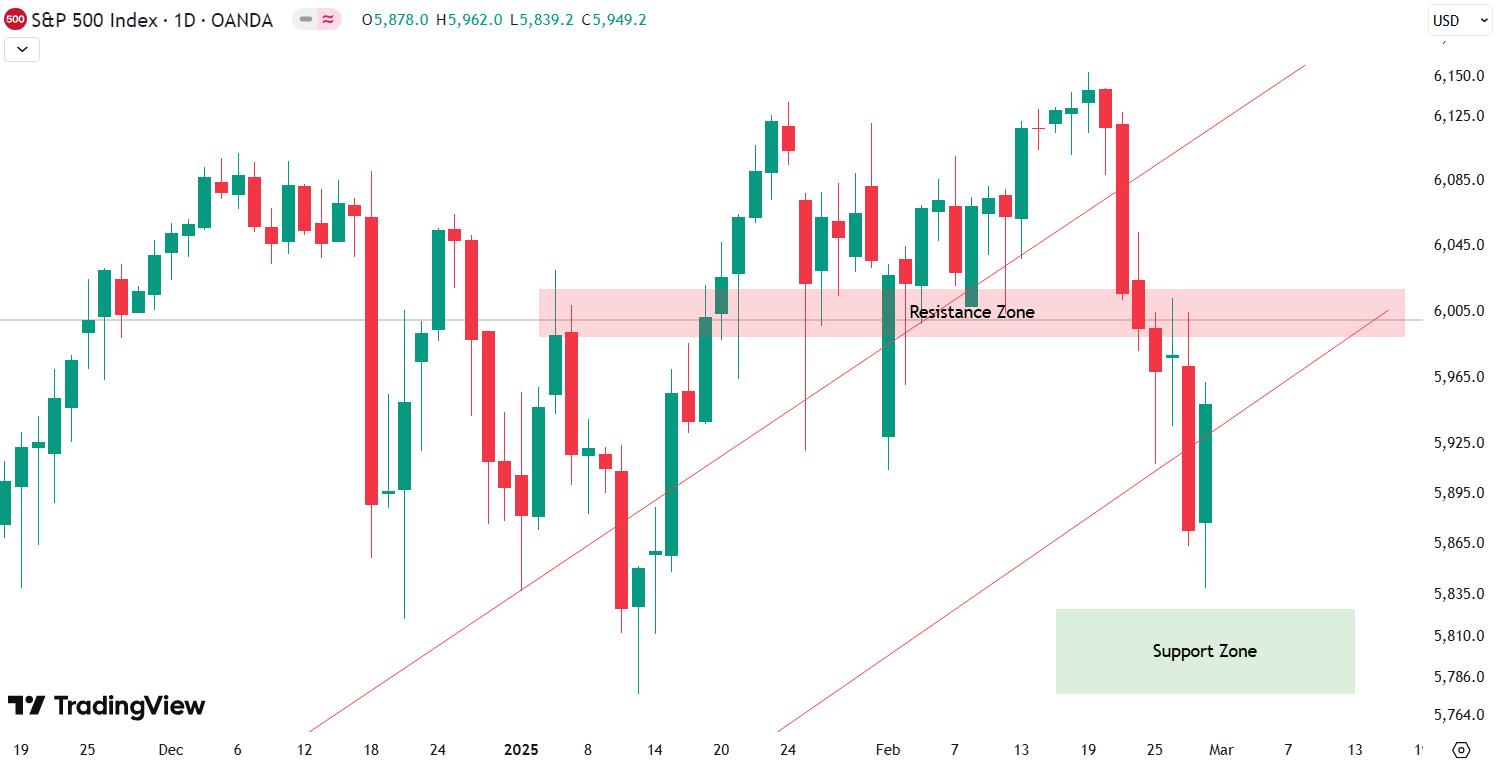
Wöchentliches Update S&P 500
Welcome to our weekly newsletter on the S&P 500! This week, the S&P 500 lost 3.1%, marking another tough week for the market. Looking at the 4-hour chart, we can see how the 6,000-point level—which used to be strong support—has now turned into a resistance zone. As expected, the market saw a bounce on Monday,…
-
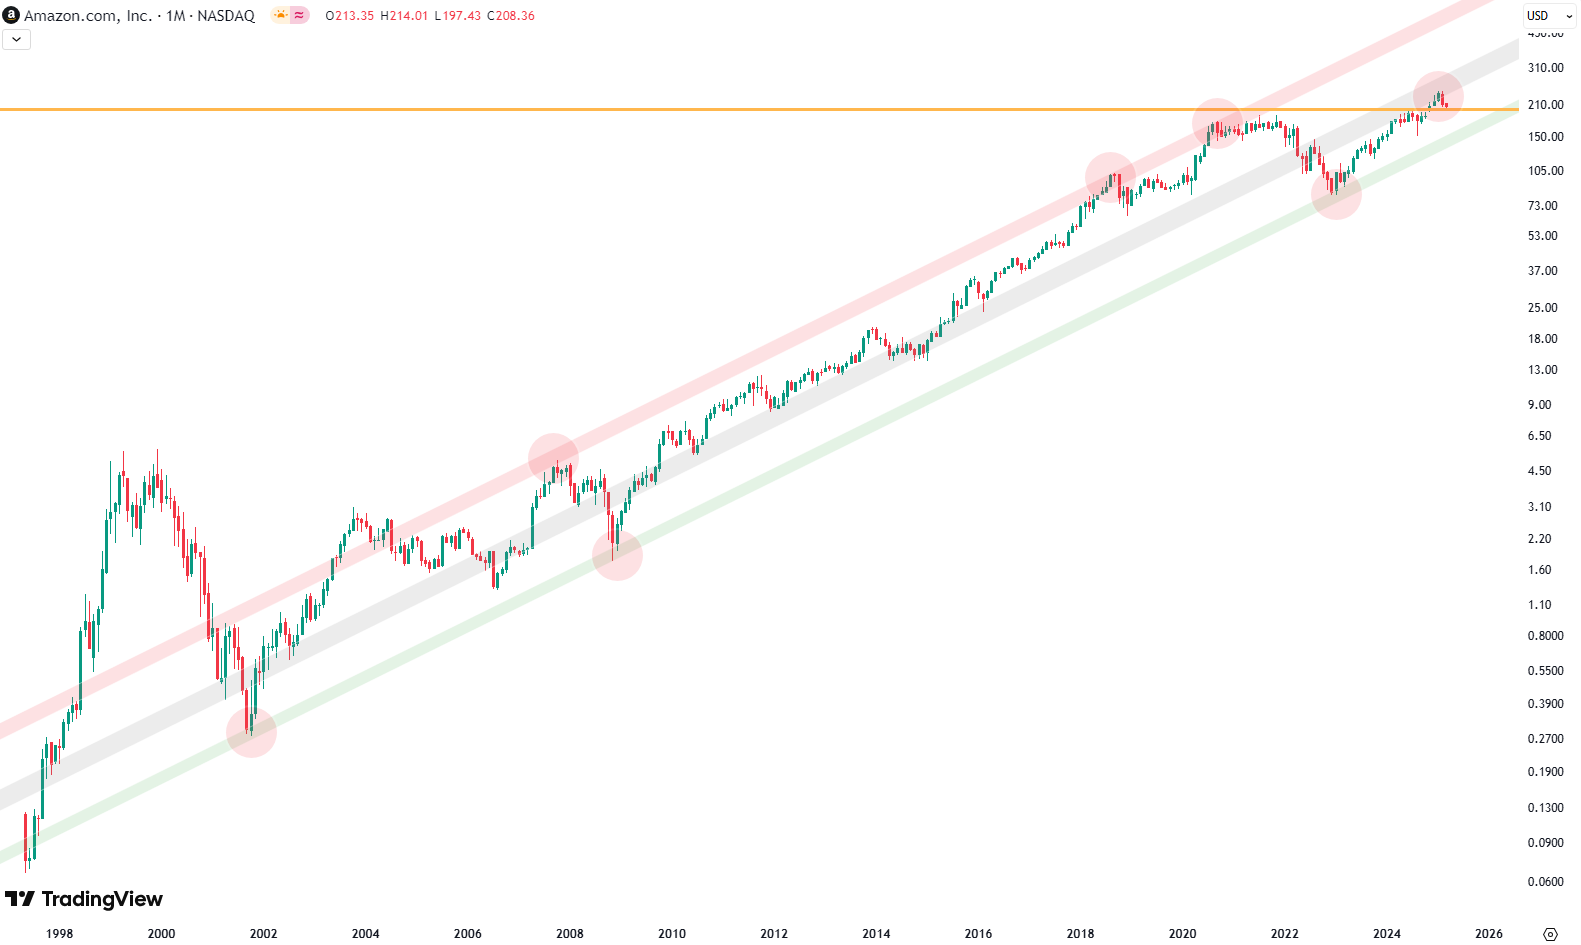
Amazon Hits Key Technical Level – Is It a Buy or a Warning Sign?
Amazon’s stock has been on a wild ride over the years, climbing steadily within a well-defined trend channel. If you look at the long-term chart, stretching all the way back to 1998, you’ll see a clear upward trajectory, with key support and resistance levels shaping its movement. One of the most important trendlines has been…
-
Wöchentliches Update S&P 500
This week, the S&P 500 had a loss of 1.1%. The S&P 500 saw a sharp decline this week. Last week, we pointed out that the index had closed below the green trendline on the chart. At that time, we were still holding above the key 6,000-point support zone. However, this week, sellers took control,…
-
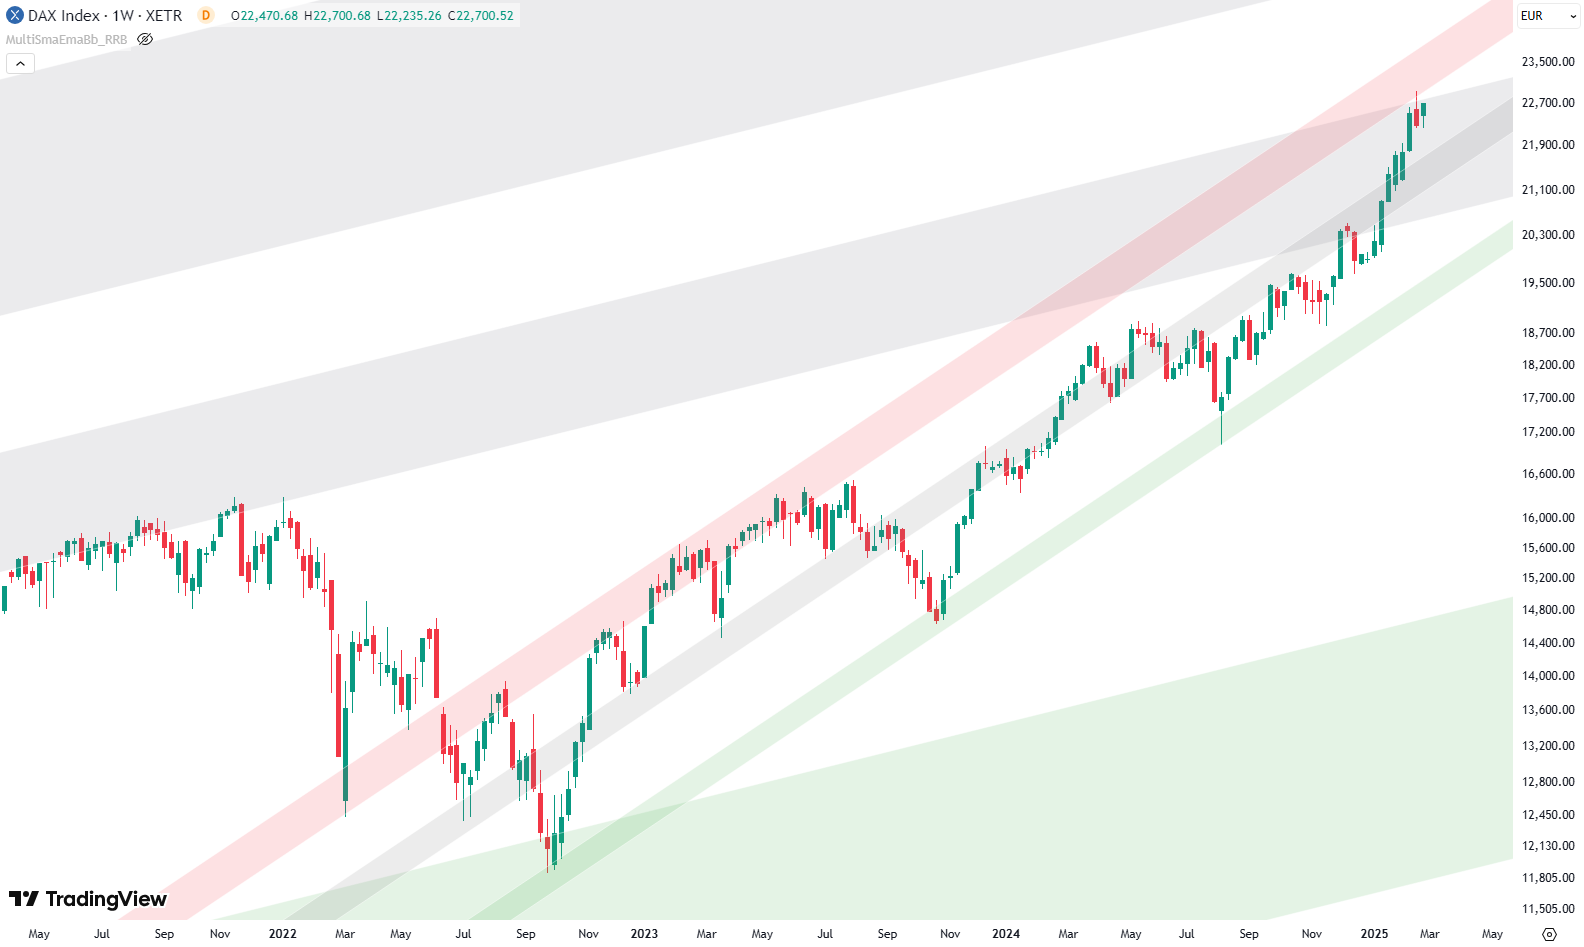
Has the DAX Reached Its Limit? A Chart Breakdown
Hello, everyone! This week, we’re diving into the DAX and its long-term trends. Looking at the quarterly chart, each candle represents three months, giving us a broad perspective all the way back to 1980. The trend is clear—DAX has been moving within a well-defined channel, respecting key support and resistance levels. The green shaded area…
-
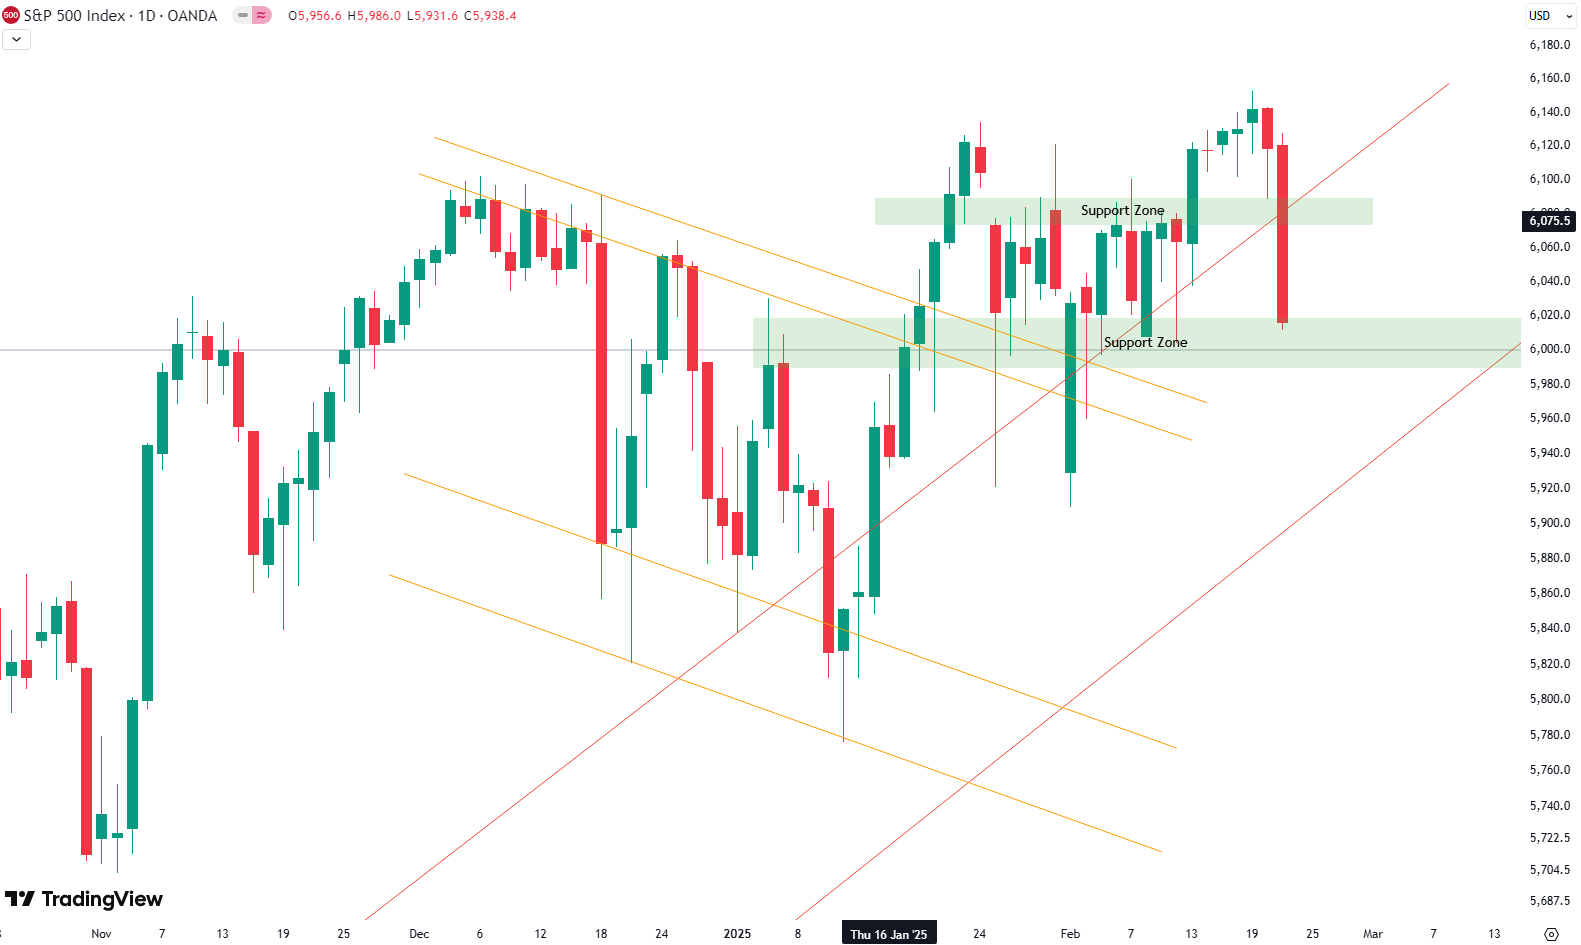
Wöchentliches Update S&P 500
This week, the S&P 500 had another rollercoaster ride, ending with a 1.7% loss. Looking at the 4-hour chart, the market remained relatively stable for most of the week, moving sideways before a small drop on Thursday, a brief recovery, and a sharp sell-off on Friday. As seen in the chart, the green support zone…
-
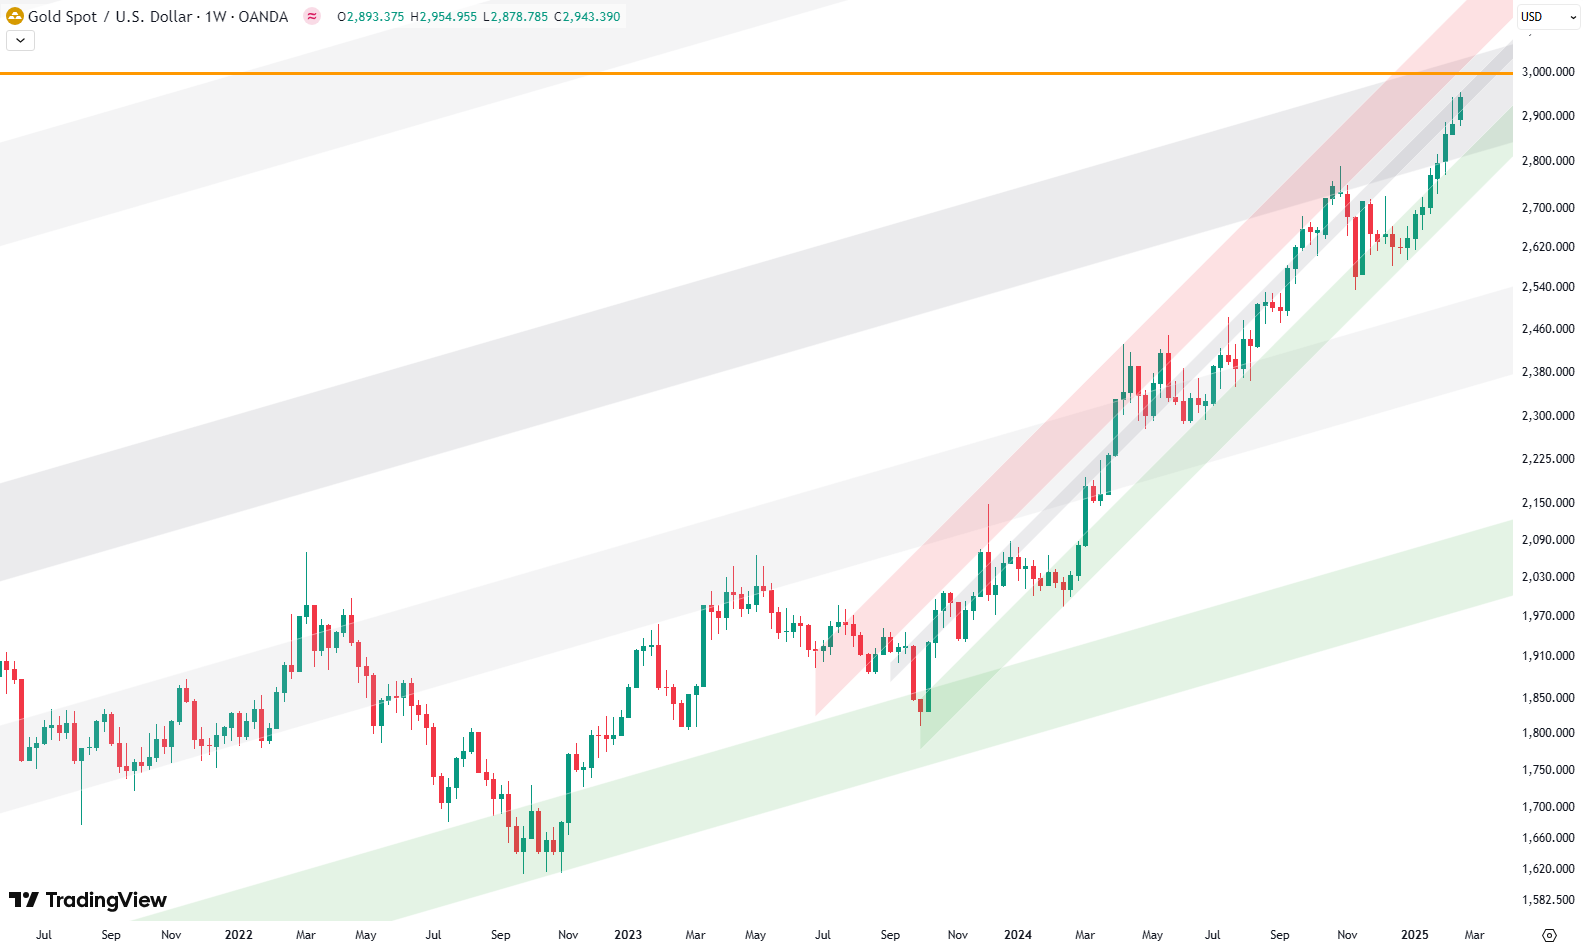
Will Gold Break $3,000 or Correct Soon?
Gold has been on an incredible run, and if you’ve been watching the charts, you know it’s been climbing steadily. But the big question now is: Can gold break the crucial $3,000 mark, or is a correction just around the corner? Gold’s Long-Term Climb – A Look at the Monthly Chart Taking a step back,…
-
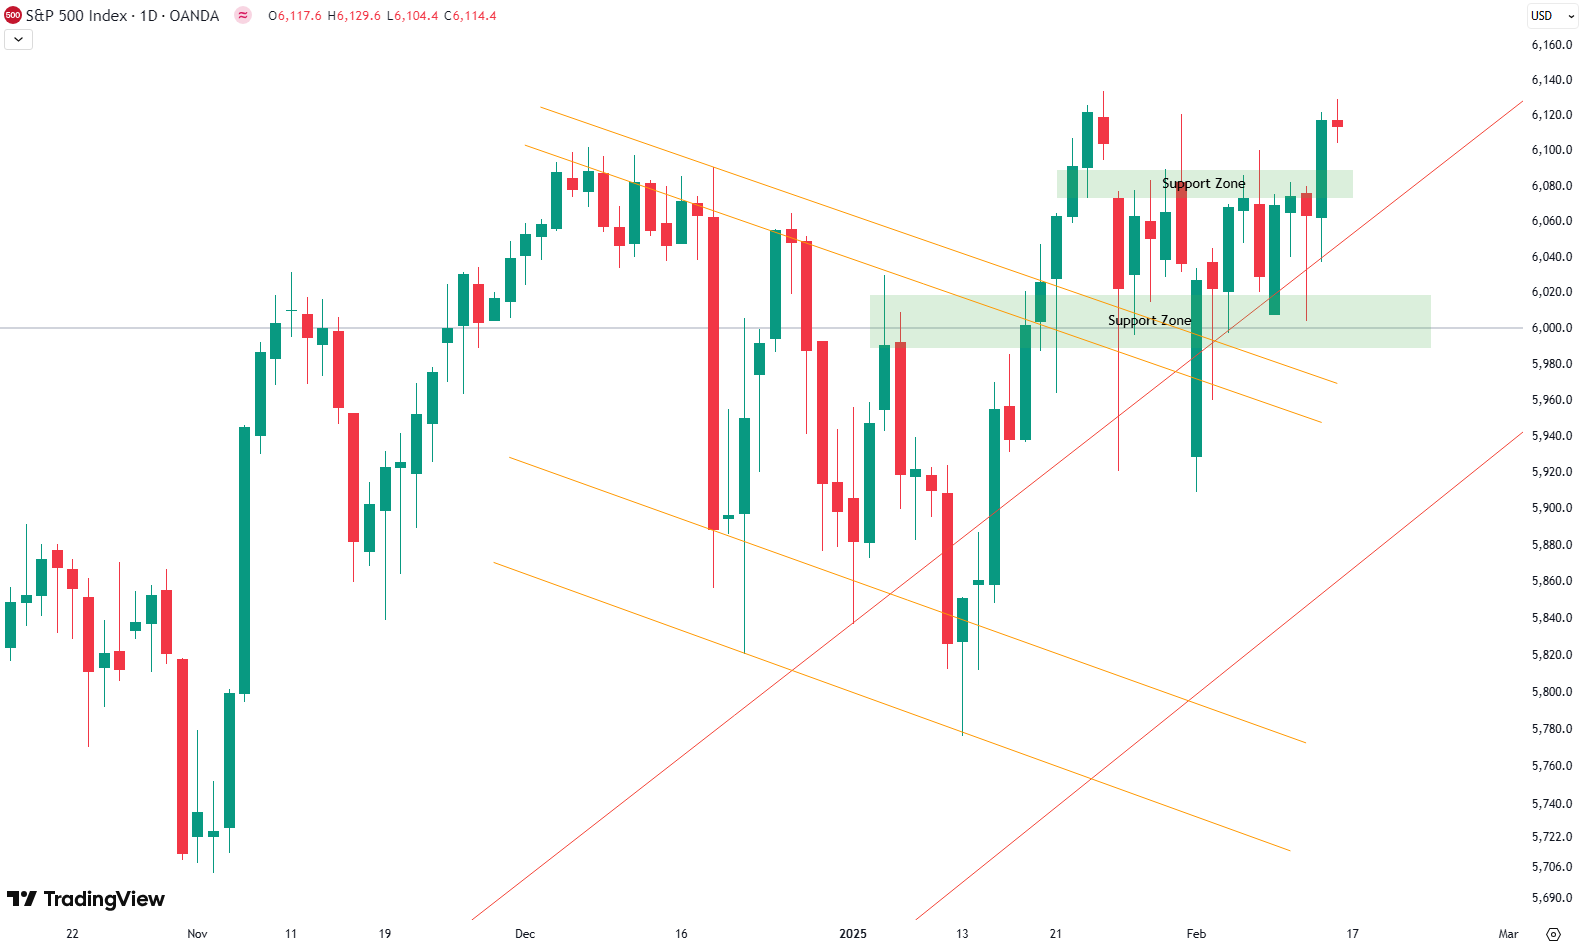
Wöchentliches Update S&P 500
This week, the S&P 500 gained 1.5%, showing strength after weeks of consolidation. As seen in the chart, the 4-hour timeframe highlights increased volatility, with price swings in both directions. Instead of a clear correction to the downside, the market has been moving sideways, building a base around the 6,000-point mark, which has repeatedly acted…
-
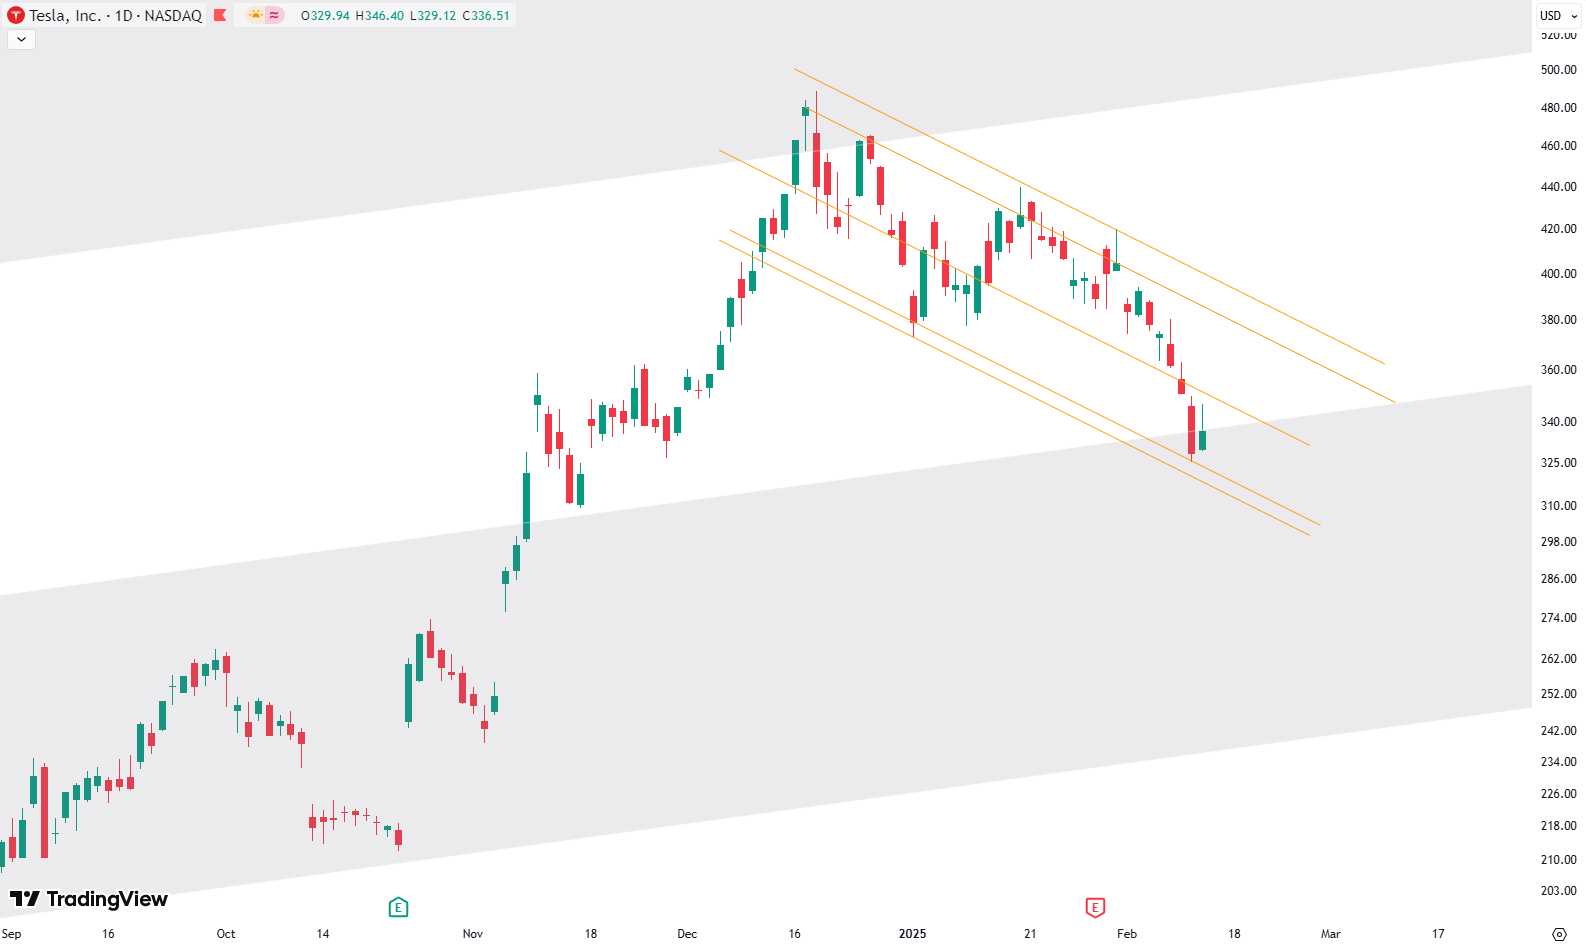
Tesla’s Recent Decline in Perspective: What the Charts Say
Tesla’s Stock Drop: A Healthy Correction or More Pain Ahead? Tesla’s recent decline has some investors worried, but let’s put it into perspective. Looking at the monthly chart, Tesla has been moving within a well-defined trend channel since 2011. This trend consists of multiple parallel support and resistance levels—green, gray, and red shaded areas—that have…