A Pullback After Overbought Levels
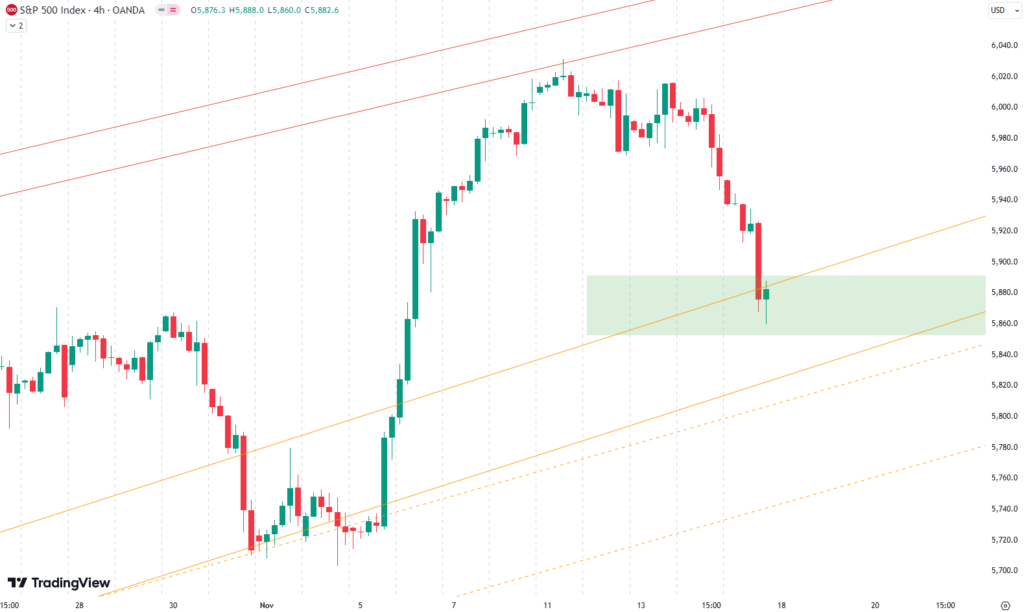
Welcome to our weekly newsletter on the S&P 500! This week, the index experienced a -2.0% decline, following a strong post-election rally. Last week, we noted the S&P 500’s overbought condition as it approached a long-standing resistance trendline on the weekly chart (marked in red).
From Monday onward, the index struggled and began to pull back. The sell-off intensified on Thursday and Friday, bringing the S&P 500 into a green support zone highlighted in earlier analysis.
The recent pullback isn’t surprising, as markets often consolidate after significant gains. After a robust three-day surge post-election, it seems the S&P 500 needed time to rest. Whether this support zone holds will be crucial in determining the market’s next move.

Our last position, which we placed on August 8th, has been active until September 5th, when we sold it for a gain of 7.7%
Sie fragen sich, wann Sie als Investor den S&P 500 kaufen sollten? Entdecken Sie unsere maßgeschneiderten Dienstleistungen und schließen Sie sich unserer wachsenden Gemeinschaft von Do-it-yourself-Investoren an, die sich mit unserer Anleitung erfolgreich auf dem Markt zurechtgefunden haben.
Premium Guide
Advanced Investing Signals
139€ / Monat
Basic Guide
Basic Investing
Signals
49€ / Monat
Simple Guide
Selected
Signals
Kostenfrei
Congratulations! You’ve discovered your new free financial guide. Simply sign up for our most popular service, our Simple Guide.
S&P 500 Rising Wedge Tightens
Since its August low, the S&P 500 has risen 15.5%, but the current consolidation is bringing attention back to key technical indicators.
The daily chart shows a rising wedge pattern with red resistance trendlines at the top and orange support trendlines at the bottom. This week, the index tested the red resistance line on Monday and then began a sell-off through the week, settling back into the green support zone.
Interestingly, the wedge pattern is tightening, meaning the S&P 500 is approaching a point where it must break out or break down. A short-term cycle bottom could also emerge soon, as indicated by the gray-shaded area on the chart.
One key development is the adjustment of the orange support trendlines. The original trendlines have been on the chart for weeks, but with a new low formed at the election, these trendlines have been slightly redrawn as dashed orange lines. The new lines suggest the possibility of further downside if the index tests lower levels.
It’s important to monitor whether the S&P 500 respects the original support or if it shifts to the adjusted trendlines. The resolution of this wedge pattern will likely guide the market’s next direction.
For subscribers it is very important to follow our risk management measures that we provide with all our services to protect against losses in case support zones break

S&P 500: An Unusual Year for Seasonality
Historically, the S&P 500 tends to follow seasonal patterns. Typically, markets weaken leading up to the November election, followed by a rally into the end of the year. This year, however, deviated from the norm. There was no significant correction before the election.
Instead, the S&P 500 has shown exceptional strength throughout the year, with gains far outpacing those of previous years. While the seasonal pattern chart suggests a strong rally to close the year, the deviation earlier in the year indicates that the market may not follow this trajectory. This unpredictability highlights the need for caution when looking at historical trends.
However, it’s important to interpret this seasonality with caution, especially this year, as we have already experienced a significant rise in prices. Investors should consider both seasonality trends and our analysis for a balanced view. Proper risk management is essential in navigating these market conditions.

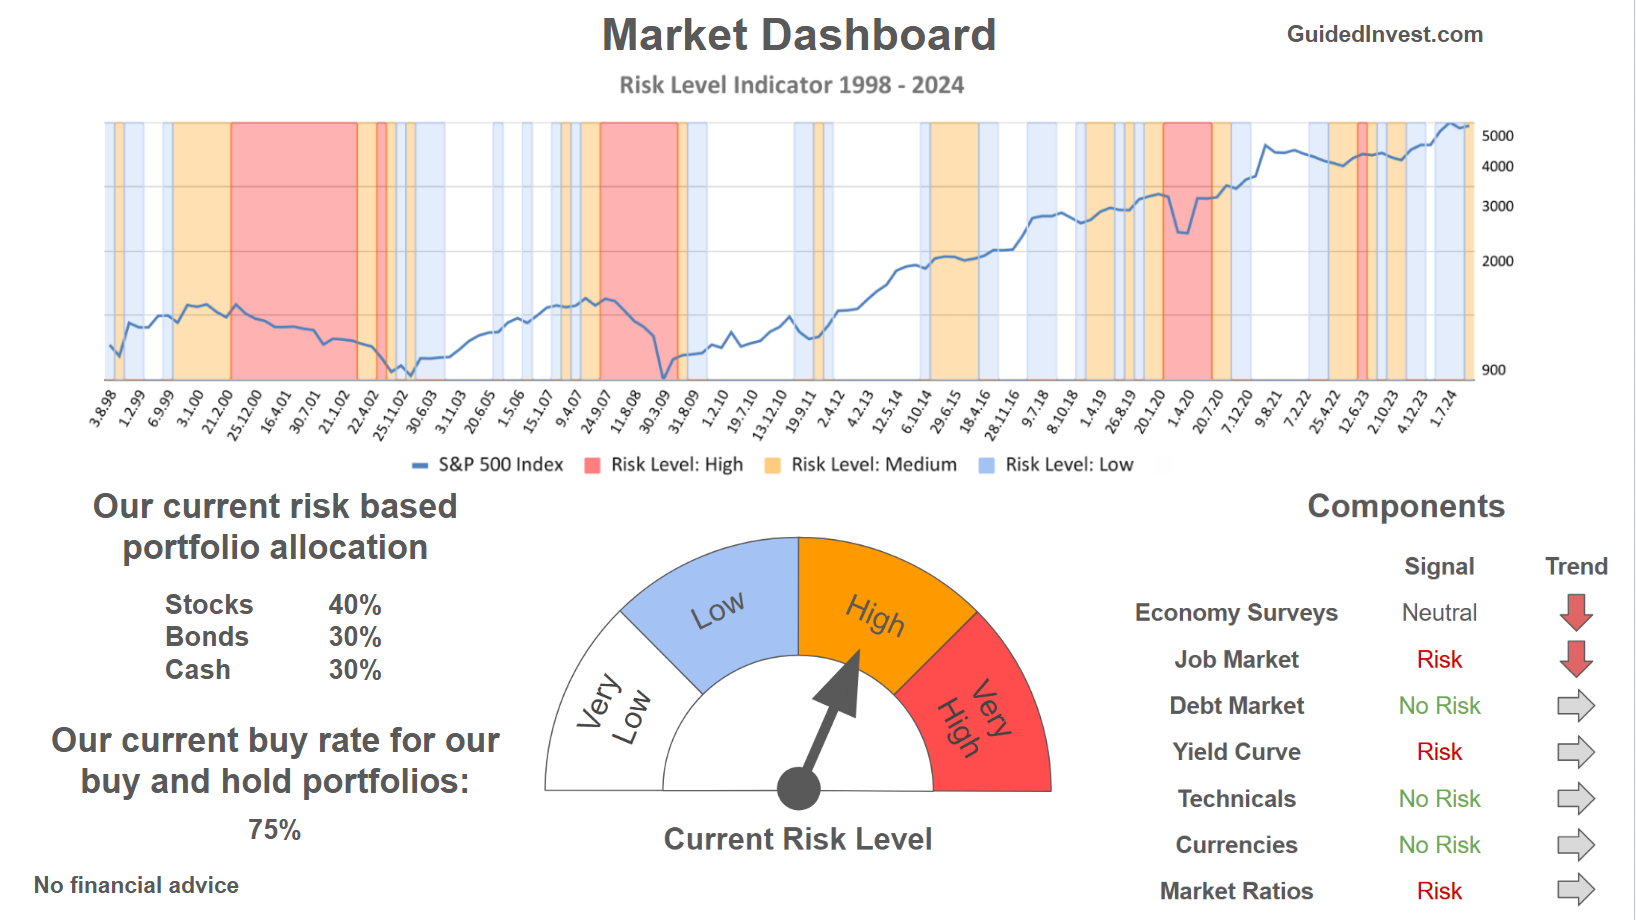
Unser Markt-Dashboard bietet einen schnellen Überblick über die aktuellen Marktbedingungen und, was noch wichtiger ist, das damit verbundene Risiko. Unten sehen sie ein Chart eines unserer Tools, des Risiko-Level-Indikators. Es zeigt das prognostizierte Risiko von 1998 bis 2024. Wenn Sie interessiert sind, können Sie hier unsere Dashboard-Seite besuchen..

Die Welt der Finanzen ist komplex und umfasst viele Fachbegriffe. Für die Erklärung dieser Begriffe empfehle ich das Lexikon von Investopedia. Investopedia dictionary.

Schreibe einen Kommentar