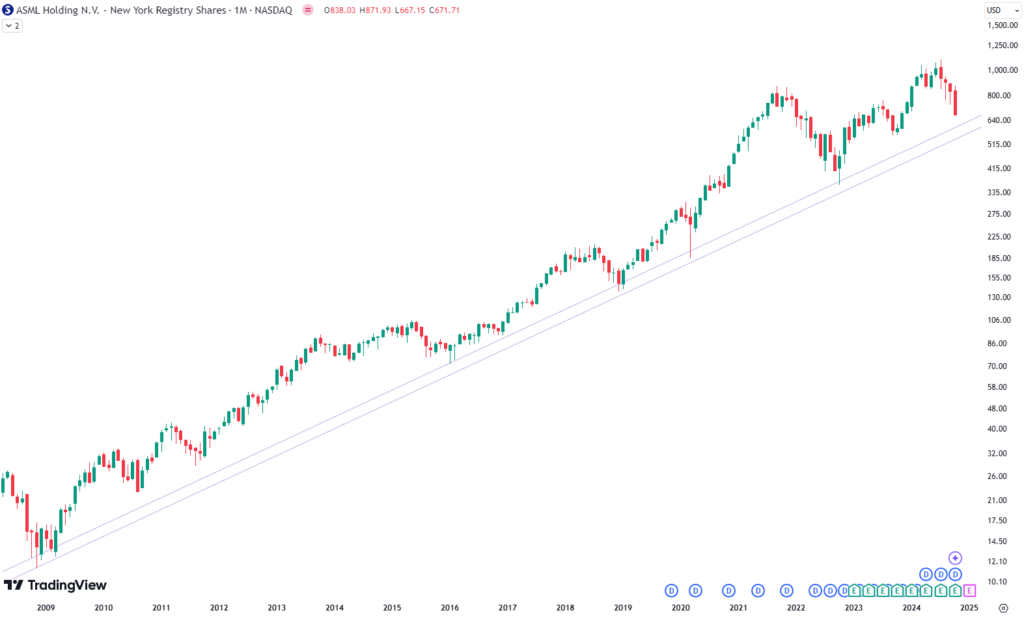
ASML, a European tech giant, plays a pivotal role in the chip-making industry by producing machines essential to high-end chip manufacturing worldwide. This company’s influence on tech cannot be overstated. ASML’s stock, which has seen long-term growth, is a popular focus for investors, especially as recent market trends bring it near a potential buying opportunity.
ASML’s Background and Industry Importance
ASML isn’t just another tech company; it’s at the forefront of semiconductor manufacturing, an industry essential to modern technology. ASML’s machines are in high demand as they help produce the advanced microchips used in everything from smartphones to medical devices. For investors, this makes ASML a solid company to watch.
Long-Term Growth: ASML’s Monthly Stock Chart
When looking at ASML’s monthly stock performance since 2009, there’s a clear upward trend, even when accounting for short-term dips. The stock price has shown a tendency to bounce back every time it reaches a specific trend line (purple on the chart), providing investors with good long-term buying opportunities. This pattern suggests a degree of stability and resilience, which is attractive for those investing with a multi-year perspective.

Are you wondering when to buy ASML as an investor? Explore our tailored services and join our growing community of do-it-yourself investors who have successfully navigated the market with our guidance.
Premium Guide
Advanced Investing Signals
139€ / Monat
Basic Guide
Basic Investing
Signals
49€ / Monat
Simple Guide
Selected
Signals
Kostenfrei
Congratulations! You’ve discovered your new free financial guide. Simply sign up for our most popular service, our Simple Guide.
Recent Downtrend: ASML’s Weekly Stock Chart
In the past few months, ASML has experienced a significant downturn, with its stock price falling nearly 40% from its all-time high. This decline has been sharp, reflecting a mix of market factors. However, the weekly chart reveals a “support zone” where the stock price may find stability, aligning with the long-term trend line. If the stock price holds in this zone, it could provide an interesting entry point for investors.

Support Zones and Resistance Levels
Support zones are areas where a stock’s price tends to find stability, preventing further declines, while resistance levels mark where it might struggle to go higher. ASML’s weekly chart shows both, with a horizontal support zone coinciding with the long term trend line where the green box is in the chart. This suggests that, should the price settle around these levels, it could mark the beginning of a new upward trend, making this a potential buying opportunity for investors looking at the long term.
A Long-Term Investment Outlook
While it’s impossible to predict future movements with certainty, ASML’s consistent long-term growth and its current position near a support zone make it an intriguing option for patient investors. It’s worth remembering that trends in high-tech stocks can take time to play out, so this opportunity may require patience over the coming months. As always, understanding the potential for both risks and rewards is key to making informed decisions.
Die Welt der Finanzen ist komplex und umfasst viele Fachbegriffe. Für die Erklärung dieser Begriffe empfehle ich das Lexikon von Investopedia. Investopedia dictionary.

Schreibe einen Kommentar