
This week, we’re diving back into Nvidia. A few weeks ago, we discussed the company and focused on its price movements around a key logarithmic trend line. Since mid-June, Nvidia has seen wild swings, with 20-30% fluctuations in both directions.
Sie fragen sich, wann Sie als Investor Nvidia kaufen sollten? Entdecken Sie unsere maßgeschneiderten Dienstleistungen und schließen Sie sich unserer wachsenden Gemeinschaft von Do-it-yourself-Investoren an, die sich mit unserer Anleitung erfolgreich auf dem Markt zurechtgefunden haben.
Premium Guide
Advanced Investing Signals
139€ / Monat
Basic Guide
Basic Investing
Signals
49€ / Monat
Simple Guide
Selected
Signals
Kostenfrei
Congratulations! You’ve discovered your new free financial guide. Simply sign up for our most popular service, our Simple Guide.
On the first chart, you can see Nvidia’s price from 2022 on a logarithmic scale, where it closely follows this trend line. Each time Nvidia’s price dipped into this trend line, it quickly bounced back. In August, Nvidia once again tested this trend line, bounced up, but failed to make a new all-time high. Now, it’s coming back down to test the trend line again. Although it’s bouncing, the lack of a strong rally suggests potential weakness. Typically, when testing such a trend line, we expect a strong bounce and a new high. Nvidia’s failure to achieve this is something to watch closely.

This is a weekly chart, meaning each candle represents a week of trading. The trend line stretches back to 2022, giving us a long-term perspective on Nvidia’s price behavior. If Nvidia can hold above this trend line over the next few weeks, it will be crucial in determining whether the stock can push higher. A breakdown would signal weakness, but a solid bounce could suggest renewed strength.
Zooming into 2023, Nvidia has been forming a wedge pattern since April. In the second chart, you can observe this common pattern where prices compress over time, eventually leading to a breakout or breakdown. Nvidia is now trading in a narrower range, and we’re approaching the point where this wedge will resolve itself.
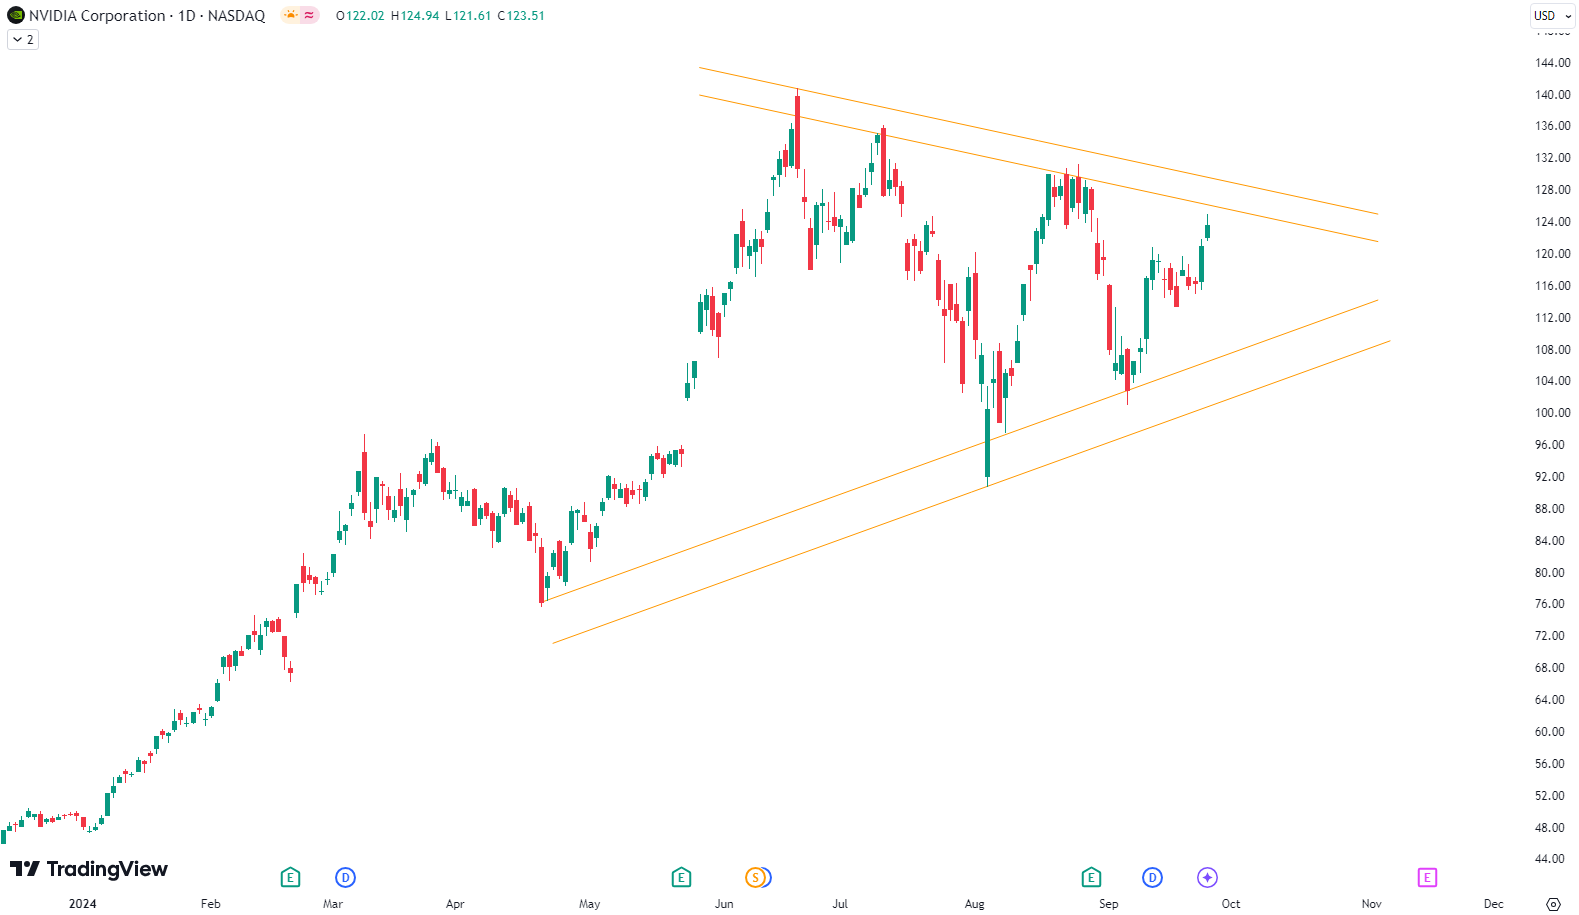
In such wedge formations, sideways price action builds energy, like compressing a spring. When the price finally breaks out, it tends to make a significant move, either to the upside or downside. Given Nvidia’s recent price action, this could lead to a strong rally if it breaks upwards or a sharp decline if it falls through the lower support.
Die Welt der Finanzen ist komplex und umfasst viele Fachbegriffe. Für die Erklärung dieser Begriffe empfehle ich das Lexikon von Investopedia. Investopedia dictionary.
Schreibe einen Kommentar