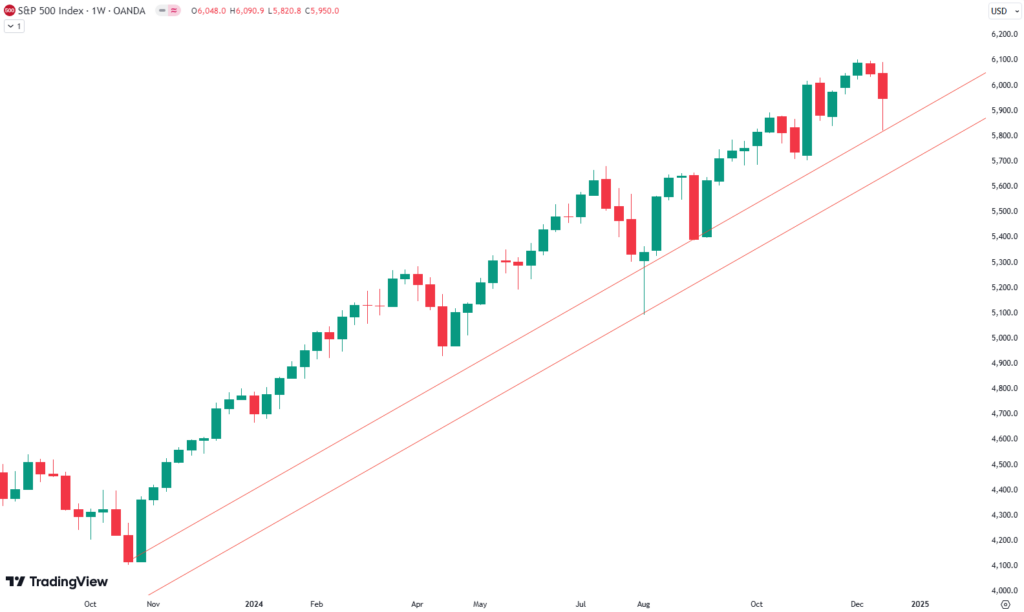
This week, the S&P 500 saw a loss of 1.6%.
This week proved to be a challenging one for the S&P 500, marked by a significant drop on Wednesday. Previously, we highlighted the increasingly compressed price action within the rising wedge formation. On Wednesday, the index finally broke below this formation following the Federal Reserve’s FOMC meeting.
During the meeting, Fed Chair Jerome Powell offered a more hawkish outlook for the coming year. This indicated fewer potential rate cuts and higher yields than anticipated by the market, leading to sharp declines. The daily chart illustrates the breakout below the orange trend lines, with little movement before Wednesday’s downturn. The resulting drop was both sudden and significant.

Our last position, which we placed on November 20, has been active until December 10, when we sold it for a gain of 5.7%
Sie fragen sich, wann Sie als Investor den S&P 500 kaufen sollten? Entdecken Sie unsere maßgeschneiderten Dienstleistungen und schließen Sie sich unserer wachsenden Gemeinschaft von Do-it-yourself-Investoren an, die sich mit unserer Anleitung erfolgreich auf dem Markt zurechtgefunden haben.
Premium Guide
Advanced Investing Signals
Basic Guide
Basic Investing
Signals
Simple Guide
Selected
Signals
Congratulations! You’ve discovered your new free financial guide. Simply sign up for our most popular service, our Simple Guide.
Is the Correction Over?
This week’s deep decline in the S&P 500 was certainly dramatic, but the market showed resilience with a significant bounce on Friday. The sell-off on Wednesday brought the index to a crucial support zone, as shown by the green box on the charts. This zone represents a confluence of horizontal support and the rising red trendline that dates back to October 2023.

Now, the market tested the first of two key red trendlines, with the second positioned slightly below. These trendlines, combined with the horizontal level, define the green support box and underline its significance.
End-of-year trading dynamics also played a role. Low market liquidity heightened volatility, leading to sharper price moves than we might see under normal conditions. While Friday’s bounce suggests that support is holding for now, the situation remains uncertain.
The critical question is whether the S&P 500 can recover the 6,000-point level. If the index reclaims this mark, the correction may be over. However, rejection at this level would indicate potential for further downside. For now, it’s a moment of cautious optimism.
For subscribers it is very important to follow our risk management measures that we provide with all our services to protect against losses in case support zones break
S&P 500: An Unusual Year for Seasonality
Historically, the S&P 500 tends to follow seasonal patterns. Typically, markets weaken leading up to the November election, followed by a rally into the end of the year. This year, however, deviated from the norm. There was no significant correction before the election.
Instead, the S&P 500 has shown exceptional strength throughout the year, with gains far outpacing those of previous years. While the seasonal pattern chart suggests a strong rally to close the year, the deviation earlier in the year indicates that the market may not follow this trajectory. This unpredictability highlights the need for caution when looking at historical trends.
However, it’s important to interpret this seasonality with caution, especially this year, as we have already experienced a significant rise in prices. Investors should consider both seasonality trends and our analysis for a balanced view. Proper risk management is essential in navigating these market conditions.

Unser Markt-Dashboard bietet einen schnellen Überblick über die aktuellen Marktbedingungen und, was noch wichtiger ist, das damit verbundene Risiko. Unten sehen sie ein Chart eines unserer Tools, des Risiko-Level-Indikators. Es zeigt das prognostizierte Risiko von 1998 bis 2024. Wenn Sie interessiert sind, können Sie hier unsere Dashboard-Seite besuchen..

Die Welt der Finanzen ist komplex und umfasst viele Fachbegriffe. Für die Erklärung dieser Begriffe empfehle ich das Lexikon von Investopedia. Investopedia dictionary.

Schreibe einen Kommentar