
The market delivered another astonishing and extremely volatile week. It all started on Monday when the S&P 500 opened nearly 4% below the previous week’s close. Things looked rough—but then came a sharp turnaround.
Both Monday and Tuesday saw strong buying interest. Then on Wednesday, things got wild. After another sharp intraday drop, the market reversed hard, surging more than 13% from the low to the high of the day. That one-day move was the strongest upside swing since World War II—yes, seriously.
On Thursday and Friday, price action cooled down a bit. The market retraced slightly but mostly held its ground. The big driver behind the midweek surge? A political catalyst: Trump’s announcement of a 90-day delay on tariffs. It sparked excitement and gave market participants a reason to dive back in.
After a rough prior week, this one was a breath of fresh air—a strong rebound that made up a significant portion of recent losses.
Our last position, which we placed on March 17th, has been active until March 31th, when we sold it for a loss.
Are you wondering when to buy the S&P 500 as an investor? Join our community of smart do-it-yourself investors who are making informed decisions with our expert insights, just by signing up with your email!
Premium Guide
Advanced Investing Signals
Basic Guide
Basic Investing
Signals
Simple Guide
Selected
Signals
Get started today with our free financial guide! Just enter your email, and you’ll start receiving our most popular Simple Guide with exclusive market signals right in your inbox.
Wild S&P 500 Rebound
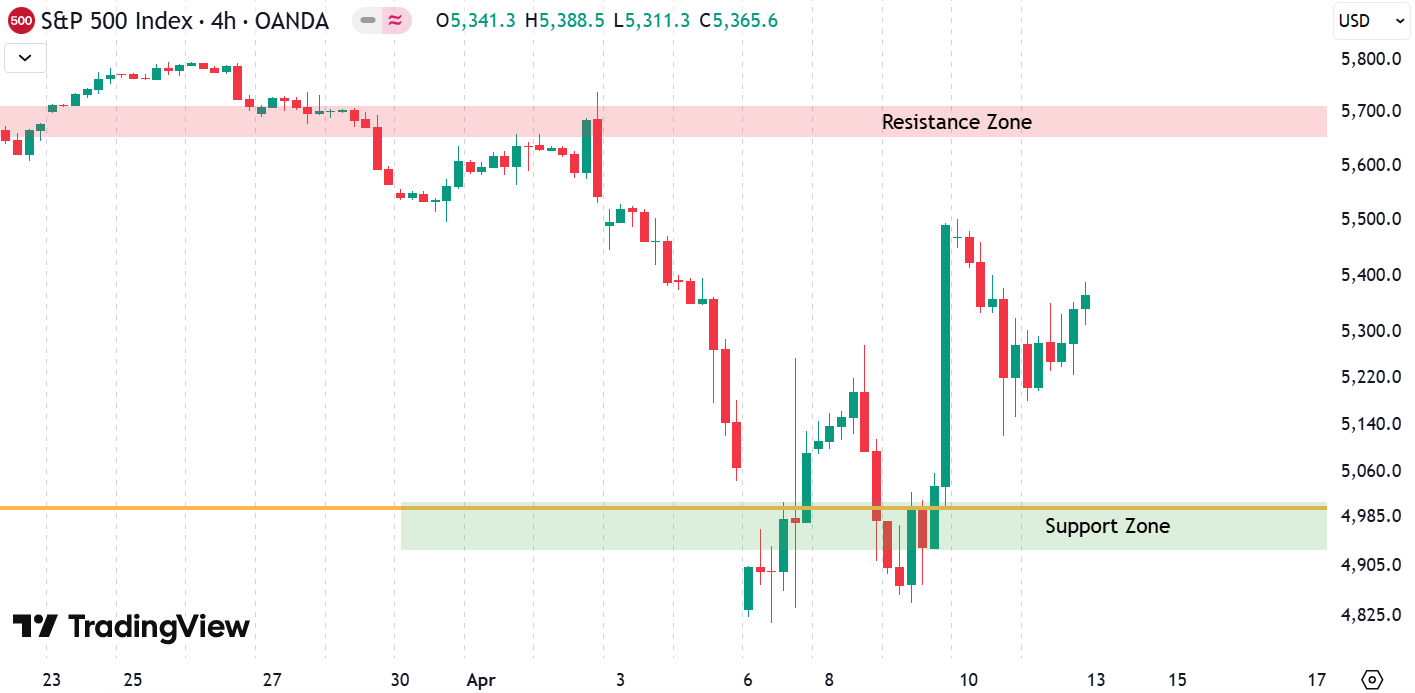
Looking at the daily chart, you can clearly spot the massive move. Friday’s drop from last week bled into Monday, but buyers stepped in. After some hesitation Tuesday, the green candle on Wednesday speaks for itself.
We had previously marked a support zone around the 5,000 level on the S&P 500, and that’s exactly where the index found its footing. From there, the market bounced aggressively, giving a textbook example of support playing out live.
But now comes the next test.
There’s a strong resistance zone ahead, shown in the chart in red. It’s the same area where the market consolidated last week and the week before. If we want to see this rebound evolve into a new bullish leg, prices will need to break above this resistance—and stay there.

If that fails, we’ll need to be cautious. A reversal at resistance could mean lower prices ahead, possibly even new lows. But for now, this week offered a solid buying opportunity for those quick enough to act.
We’ll be watching this resistance closely in the coming sessions. It’s just a few percent above current levels and could dictate what happens next.
Zooming out to the weekly chart, we can see how this recent move fits into the bigger picture. We’ve highlighted trend zones in green, grey, and red, marking support and resistance areas that date back to 2008.
Last week, we mentioned the green shaded support zone. And sure enough, this week the S&P 500 touched that exact area—and launched upward from there. It’s a strong confirmation of this long-term trend still holding up under pressure.

The next challenge is breaking through the grey resistance zone above, which also aligns with the one seen on the daily chart. That’s the level to watch.
For now, it’s encouraging to see the long-term trend since 2008 providing solid support, even during a week of intense volatility. It’s a reminder that despite noise and headlines, the broader trend still matters.
For subscribers it is very important to follow our risk management measures that we provide with all our services to protect against losses in case support zones break
Stay ahead of the market! Sign up for our weekly updates and get expert insights on the S&P 500, key support levels, and market trends.
S&P 500: Seasonality Insights for Early 2025
Seasonality charts often provide helpful context for understanding market tendencies. Historically, the S&P 500 exhibits a choppy start to the year, with January and February experiencing turbulence that can extend into mid-March. This seasonal pattern suggests the potential for weakness in the coming weeks.
However, this type of analysis should always be approached cautiously. While seasonal trends indicate broad expectations, they cannot predict the future. Notably, last year saw significant deviations from typical patterns, with strength in the market that outpaced historical norms.
If seasonality holds true, this early choppiness might be followed by stabilization. Still, after the notable price increases seen in late 2024, investors should prepare for possible volatility and ensure proper risk management strategies are in place.
Ultimately, seasonal trends provide valuable context, but they must be considered alongside current market dynamics and technical analysis for a clearer picture. The S&P 500’s behavior during this critical time will reveal whether the seasonal weakness manifests or if the market defies expectations again.

Track Market Risk with Our Dashboard
Unser Markt-Dashboard bietet einen schnellen Überblick über die aktuellen Marktbedingungen und, was noch wichtiger ist, das damit verbundene Risiko. Unten sehen sie ein Chart eines unserer Tools, des Risiko-Level-Indikators. Es zeigt das prognostizierte Risiko von 1998 bis 2024. Wenn Sie interessiert sind, können Sie hier unsere Dashboard-Seite besuchen..

Die Welt der Finanzen ist komplex und umfasst viele Fachbegriffe. Für die Erklärung dieser Begriffe empfehle ich das Lexikon von Investopedia. Investopedia dictionary.
Schreibe einen Kommentar