
Hello, everybody. This week, the S&P 500 had its share of ups and downs, ultimately ending with a 1.9% loss. On Monday and Tuesday, things were looking quite positive, with some nice gains that had investors feeling optimistic. But, as you can see in the 4-hour chart, the market’s fortunes reversed midweek.
On Wednesday, the index began to pull back, followed by some sideways consolidation on Thursday. Then came the big action on Friday—a sharp drop of over 2% that erased the earlier gains and left the market in the red for the week.
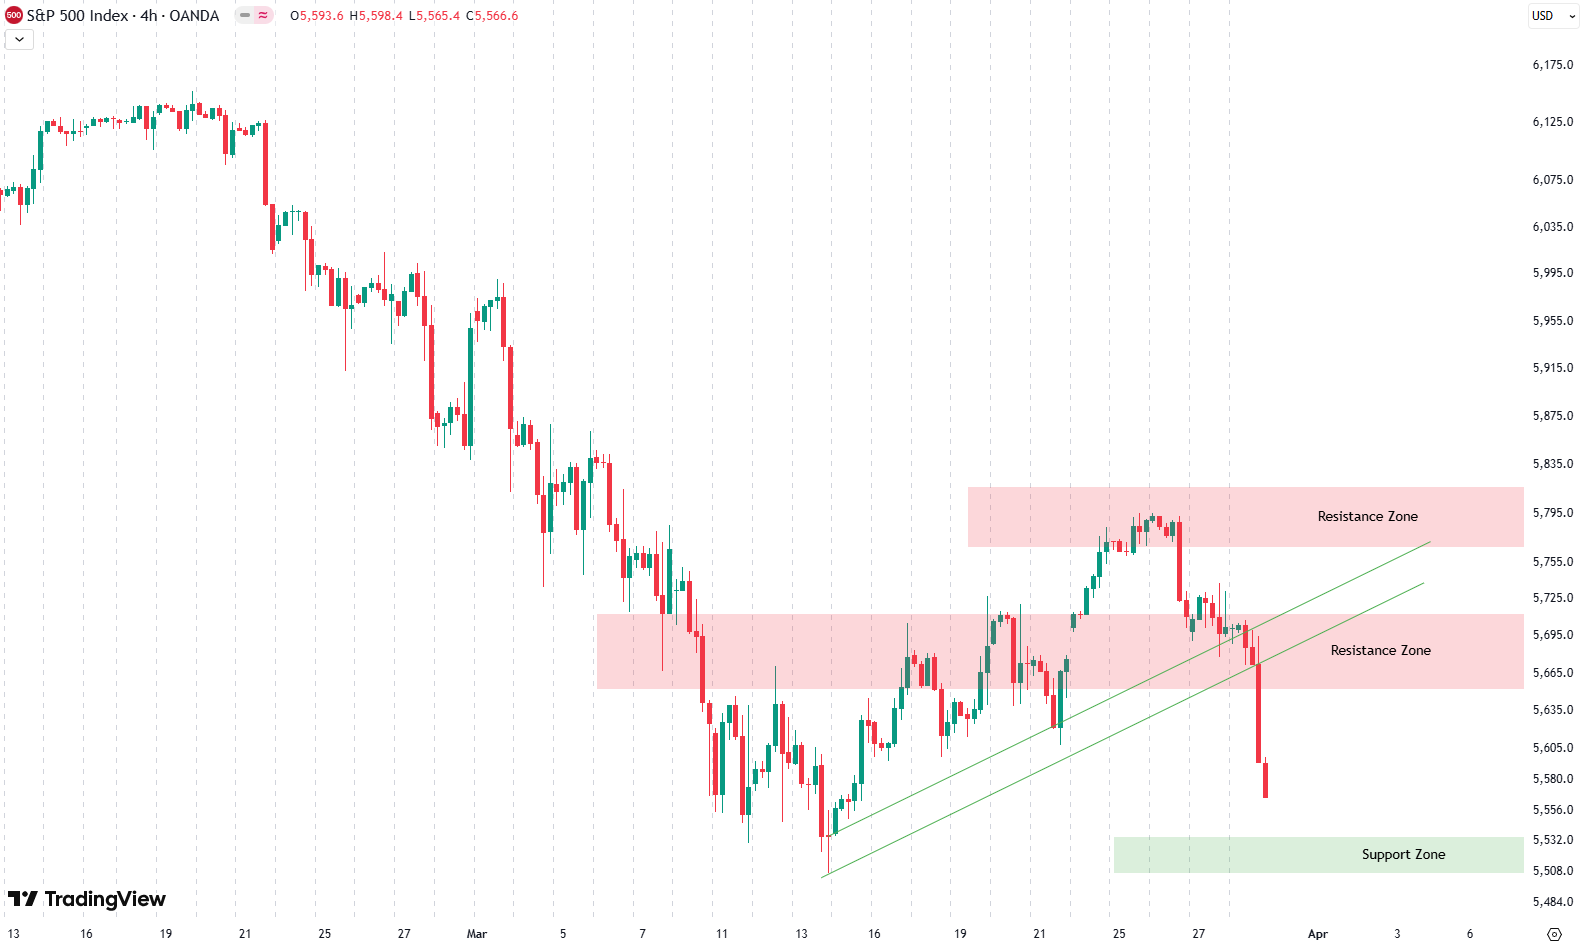
Looking at the 4-hour chart, you’ll notice the green upward-sloping trend lines that had been guiding the short-term uptrend. These trend lines provided support until Thursday, when the index tested them and managed to hold for a bit. However, on Friday, the S&P 500 broke below these trend lines.
Our last position, placed on March 17th, is currently down by 5.9%.
Are you wondering when to buy the S&P 500 as an investor? Join our community of smart do-it-yourself investors who are making informed decisions with our expert insights, just by signing up with your email!
Premium Guide
Advanced Investing Signals
Basic Guide
Basic Investing
Signals
Simple Guide
Selected
Signals
Get started today with our free financial guide! Just enter your email, and you’ll start receiving our most popular Simple Guide with exclusive market signals right in your inbox.
Market Volatility Hits S&P 500
If we zoom out and examine the daily chart, you can see that the S&P 500 has been in a steep decline since the February high. After that sharp drop, we entered a consolidation phase over the past two weeks, which seemed like it could be forming a base. But as we discussed last week, there were two key resistance zones to watch.
On Monday, the S&P 500 managed to break above the lower resistance zone, which initially looked promising. However, midweek, the index hit the upper resistance zone and was promptly rejected on Wednesday. This rejection sent prices tumbling back into the lower resistance zone, and by Friday, we saw a sharp breakdown below it.
What this suggests is that the past two weeks of consolidation were likely just a “dead cat bounce”—a temporary relief rally without real upside momentum. Sellers took advantage of the higher prices to re-enter the market and push prices lower.

Now, we’re almost back at the recent lows. As shown on the daily chart, I’ve drawn a green support zone marking the previous low. This area might provide some support for the index, but it’s uncertain whether it will hold. We’ll have to wait and see how the market behaves around this level.
The sharp decline on Friday left a large red candle on the chart, which could be a sign of growing panic in the market. If selling continues at this pace, we might be approaching a capitulation event. Capitulation happens when investors collectively throw in the towel, selling off their positions in a final wave of panic. This is often the final phase of a downtrend and may lead to a bottom, after which prices stabilize and start to recover.
Alternatively, it’s also possible that the S&P 500 is in the early stages of forming a bottom within the lower green support zone. If that’s the case, we could see prices stabilize and eventually move higher from here.
For subscribers it is very important to follow our risk management measures that we provide with all our services to protect against losses in case support zones break
Stay ahead of the market! Sign up for our weekly updates and get expert insights on the S&P 500, key support levels, and market trends.
S&P 500: Seasonality Insights for Early 2025
Seasonality charts often provide helpful context for understanding market tendencies. Historically, the S&P 500 exhibits a choppy start to the year, with January and February experiencing turbulence that can extend into mid-March. This seasonal pattern suggests the potential for weakness in the coming weeks.
However, this type of analysis should always be approached cautiously. While seasonal trends indicate broad expectations, they cannot predict the future. Notably, last year saw significant deviations from typical patterns, with strength in the market that outpaced historical norms.
If seasonality holds true, this early choppiness might be followed by stabilization. Still, after the notable price increases seen in late 2024, investors should prepare for possible volatility and ensure proper risk management strategies are in place.
Ultimately, seasonal trends provide valuable context, but they must be considered alongside current market dynamics and technical analysis for a clearer picture. The S&P 500’s behavior during this critical time will reveal whether the seasonal weakness manifests or if the market defies expectations again.

Track Market Risk with Our Dashboard
Unser Markt-Dashboard bietet einen schnellen Überblick über die aktuellen Marktbedingungen und, was noch wichtiger ist, das damit verbundene Risiko. Unten sehen sie ein Chart eines unserer Tools, des Risiko-Level-Indikators. Es zeigt das prognostizierte Risiko von 1998 bis 2024. Wenn Sie interessiert sind, können Sie hier unsere Dashboard-Seite besuchen..

Die Welt der Finanzen ist komplex und umfasst viele Fachbegriffe. Für die Erklärung dieser Begriffe empfehle ich das Lexikon von Investopedia. Investopedia dictionary.
Schreibe einen Kommentar