
Hello, everybody. This week, we’re taking a closer look at Rheinmetall, a leading European defense company that has seen incredible gains over the past few months—and, honestly, over the past couple of years. Since November 2024 alone, the stock has skyrocketed around 160%. That’s no small feat. Let’s break down what’s happening by diving into the charts and seeing where things might be headed.
Weekly Chart: Approaching the Red Zone
We’ll start with the weekly chart, where we’re looking at a longer timescale. You’ll notice three key shaded areas: green, red, and gray. These zones give us some clues about potential future price action.
The green shaded area marks the lower part of the trend channel and has acted as a reliable support zone going all the way back to 2022. Each time prices dipped into this area, they bounced back. It’s like a safety net for the stock.

On the flip side, the red shaded area at the top of the trend channel is where things get tricky. This zone has been acting as resistance—basically capping how high prices can go. And right now, after that massive run-up, Rheinmetall’s stock has entered this red zone.
I’ve marked the last two times prices hit this resistance area with red circles. What happened then? Well, prices didn’t crash, but the upside became limited, and things moved sideways for weeks or even months. It’s possible we’ll see a similar pattern here.
At some point, we might see prices pull back toward the gray shaded area, which acts as a sort of balance line within the trend channel. This gray zone has provided both support and resistance in the past, so it’s worth keeping an eye on.
Want to know the best time to invest in the Rheinmetall? Join our community of smart do-it-yourself investors who are making informed decisions with our expert insights, just by signing up with your email!
Premium Guide
Advanced Investing Signals
Basic Guide
Basic Investing
Signals
Simple Guide
Selected
Signals
Get started today with our free financial guide! Just enter your email, and you’ll start receiving our most popular Simple Guide with exclusive market signals right in your inbox.
Daily Chart: Zooming In on Recent Moves
Switching to the daily chart gives us a closer look at what’s been happening recently. You can clearly see the strong upward move that started in November last year. But after this impressive rally, we’re starting to see the first few down days—likely a reaction to hitting that red resistance zone on the weekly chart.
On this chart, I’ve marked two potential support zones with green boxes. The upper support zone has already been tested once, and there’s a chance prices might test it again as they move sideways. The lower support zone sits a bit further down at around 1,100 euros per share.
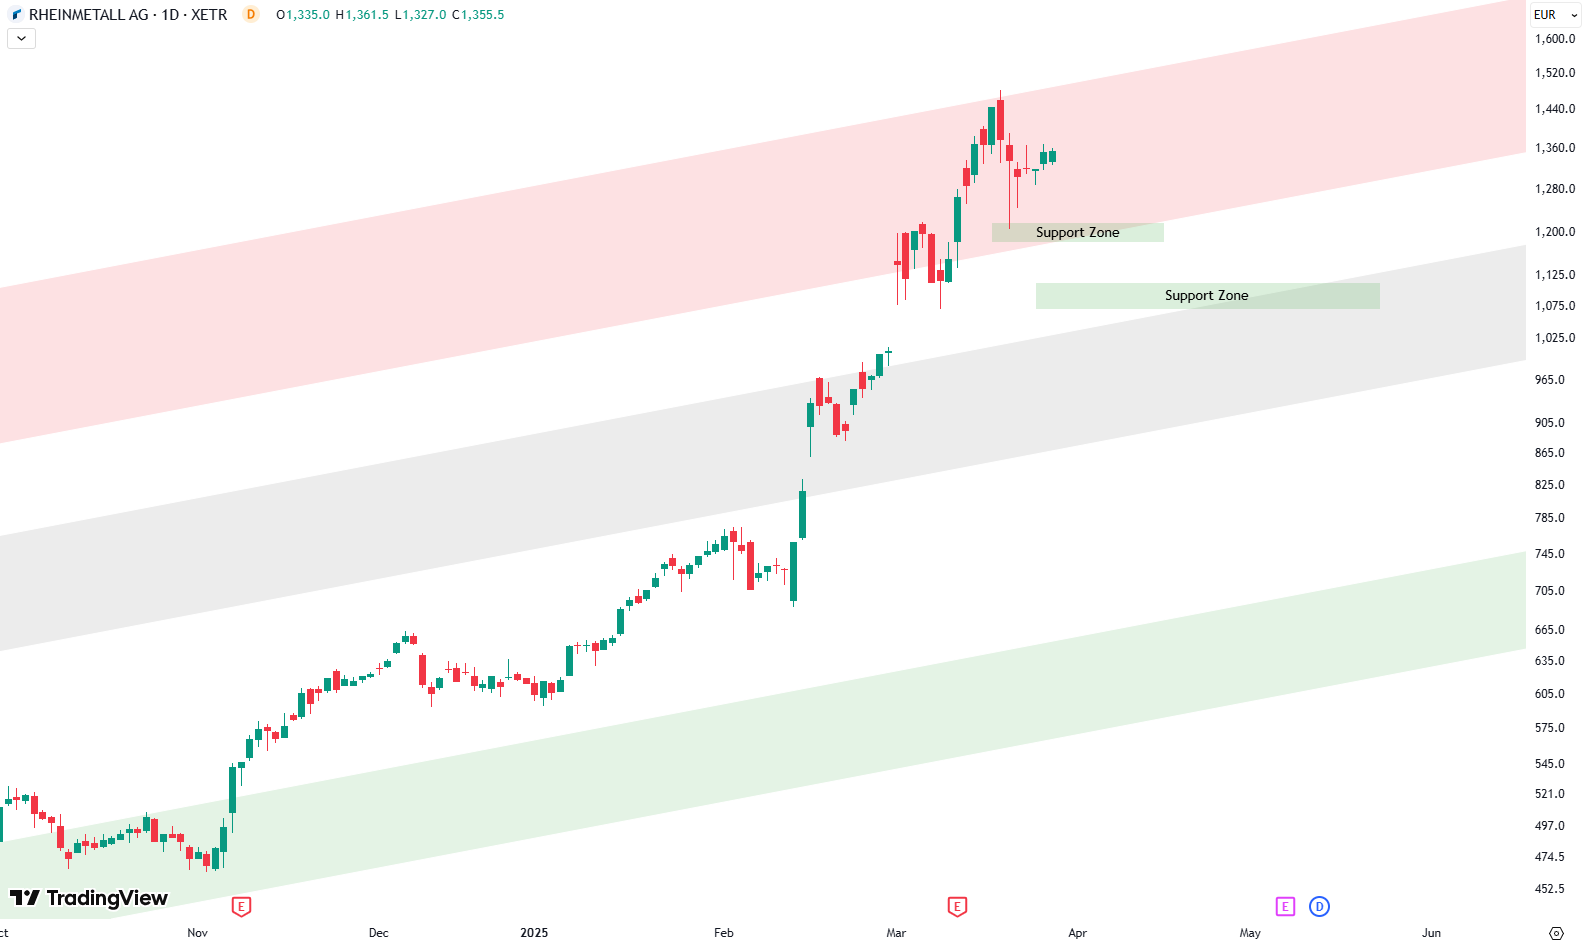
Why is this lower zone important? Well, it lines up with two different types of support: the horizontal support from the green box and the rising support from the gray shaded area within the trend channel. When two support levels line up like that, it often makes for a stronger floor. If prices do move lower and test this area, it could be a great spot to watch for a rebound.
What’s Next?
For now, it looks like Rheinmetall might trade sideways for a bit, possibly retesting the upper support zone before eventually moving lower to test that stronger support around 1,100 euros. After that, we could see prices start to climb again—but, as always, we’ll have to wait and see how things develop.
It’s a good time to stay cautious and keep an eye on those key levels. If you’d like to get more insights and signals from our experts, consider signing up with your email to stay ahead of the curve.
Microsoft has followed a predictable pattern for years, and right now, we’re at a moment where things could turn around again. Whether you’re looking to enter or just tracking the market, this is a key level to watch.
The world of finance can be complex, with many technical terms. For explanations of financial terminology, try using the Investopedia dictionary.
Schreibe einen Kommentar