
Welcome to our weekly newsletter on the S&P 500!
This week, the S&P 500 gained 0.5%. While it wasn’t a massive move, it did bring some important technical patterns into play. Let’s break down what happened on the charts and what it could mean for the coming weeks.
Weekly Overview: Testing Key Resistance Levels
The week kicked off with a push higher on Monday, followed by a pullback on Tuesday. We saw a renewed move upward on Wednesday, but by Thursday and Friday, the market mostly traded sideways. You can see this action clearly on the 4-hour chart, where each candle represents four hours of price movement.
What’s especially notable this week is that we broke above the green downward-sloping trendlines on Monday. This breakout is a positive sign, as it suggests that bullish momentum is building. After the breakout, Tuesday’s pullback retested those green trendlines from above—and the market held its ground. That’s an encouraging signal for bulls.

However, we’re not out of the woods yet. Right now, the S&P 500 is sitting near a resistance zone. On the 4-hour chart, you’ll notice a red box highlighting this resistance area, which lies around 5,680 points. This zone has acted as a ceiling for price action before, and it’s the next major hurdle the market needs to clear if we’re going to see more upside next week.
Our last position, placed on March 17th, is currently up by 0.3%.
Are you wondering when to buy the S&P 500 as an investor? Join our community of smart do-it-yourself investors who are making informed decisions with our expert insights, just by signing up with your email!
Premium Guide
Advanced Investing Signals
Basic Guide
Basic Investing
Signals
Simple Guide
Selected
Signals
Get started today with our free financial guide! Just enter your email, and you’ll start receiving our most popular Simple Guide with exclusive market signals right in your inbox.
Daily Chart: A Closer Look at Momentum
Zooming in, the daily chart provides more insight into the current trend. After the sharp drop that followed the February highs, we’re now in the midst of a relief rally. The big question is whether this rally has enough strength to push past resistance.
This current resistance zone, marked by the red box, comes from a previous low formed back in November (you’ll see it circled on the left-hand side of the daily chart). It’s common for previous lows to turn into resistance when prices rally back toward them—which is exactly what we’re seeing now.
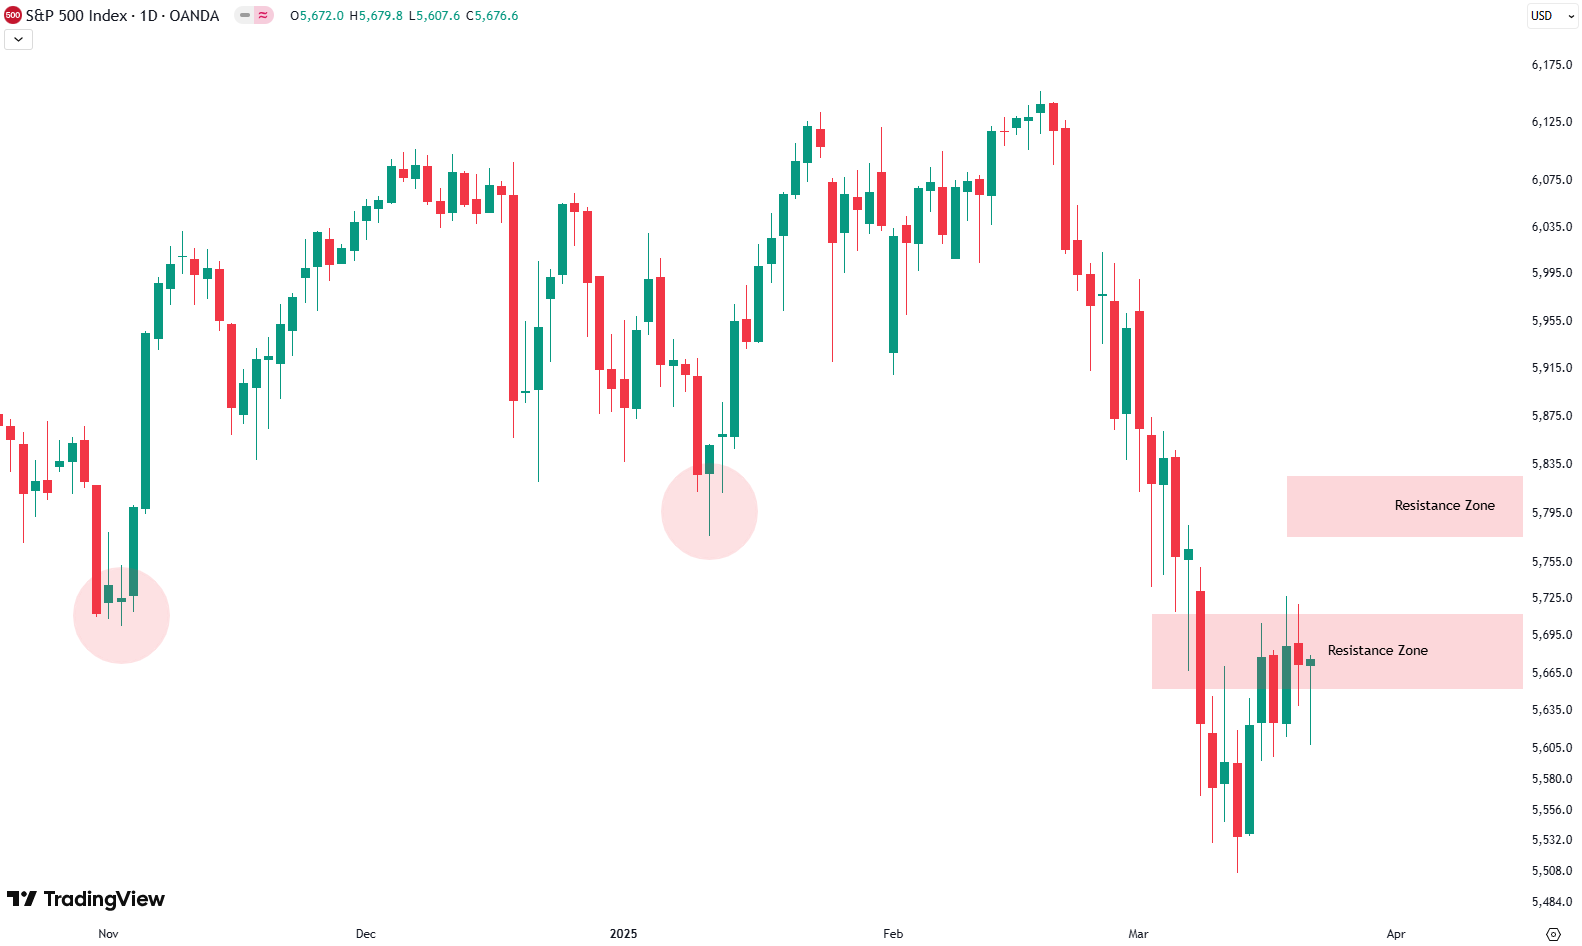
Above this initial resistance, there’s a second resistance zone around 5,800 points. This one is based on a low from January. To see significant upside, the S&P 500 would need to break through both of these zones. For now, though, we’re focusing on the immediate resistance near 5,680 points.
Weekly Chart: Long-Term Perspective
Looking at the big picture, the weekly chart adds even more context. Last week, we saw a clean test of the lower green trendline that forms the base of the trend channel we’ve been following for the past two years. The candle from last week had a long wick, indicating that buyers stepped in at this key support level.

In addition to the trend channel, there’s also a shaded gray area representing an even longer-term trend. This area has provided support in the past, and the fact that we’re still holding above it is a positive sign. That said, no support level holds forever—and it’s important to stay vigilant.
What’s Next for the S&P 500?
Given the recent price action, a continued relief rally seems likely in the short term. However, markets rarely move in straight lines, and we could still face volatility. If the S&P 500 fails to break above the current resistance, we might see a quick pullback toward lower support levels.
This week’s action has set the stage for an interesting battle between bulls and bears. If the S&P 500 can break through resistance, we could see more upside in the weeks ahead. If not, we’ll be watching those key support zones closely. As always, stay cautious and take it one step at a time.
For subscribers it is very important to follow our risk management measures that we provide with all our services to protect against losses in case support zones break
Stay ahead of the market! Sign up for our weekly updates and get expert insights on the S&P 500, key support levels, and market trends.
S&P 500: Seasonality Insights for Early 2025
Seasonality charts often provide helpful context for understanding market tendencies. Historically, the S&P 500 exhibits a choppy start to the year, with January and February experiencing turbulence that can extend into mid-March. This seasonal pattern suggests the potential for weakness in the coming weeks.
However, this type of analysis should always be approached cautiously. While seasonal trends indicate broad expectations, they cannot predict the future. Notably, last year saw significant deviations from typical patterns, with strength in the market that outpaced historical norms.
If seasonality holds true, this early choppiness might be followed by stabilization. Still, after the notable price increases seen in late 2024, investors should prepare for possible volatility and ensure proper risk management strategies are in place.
Ultimately, seasonal trends provide valuable context, but they must be considered alongside current market dynamics and technical analysis for a clearer picture. The S&P 500’s behavior during this critical time will reveal whether the seasonal weakness manifests or if the market defies expectations again.

Track Market Risk with Our Dashboard
Unser Markt-Dashboard bietet einen schnellen Überblick über die aktuellen Marktbedingungen und, was noch wichtiger ist, das damit verbundene Risiko. Unten sehen sie ein Chart eines unserer Tools, des Risiko-Level-Indikators. Es zeigt das prognostizierte Risiko von 1998 bis 2024. Wenn Sie interessiert sind, können Sie hier unsere Dashboard-Seite besuchen..

Die Welt der Finanzen ist komplex und umfasst viele Fachbegriffe. Für die Erklärung dieser Begriffe empfehle ich das Lexikon von Investopedia. Investopedia dictionary.
Schreibe einen Kommentar