
This week, we’re taking a look at Meta, one of the biggest stocks in the S&P 500. The stock has been in a strong uptrend for quite some time, but things have taken a turn recently, making this a key moment to reassess its trajectory.
A Well-Defined Uptrend – Until Now
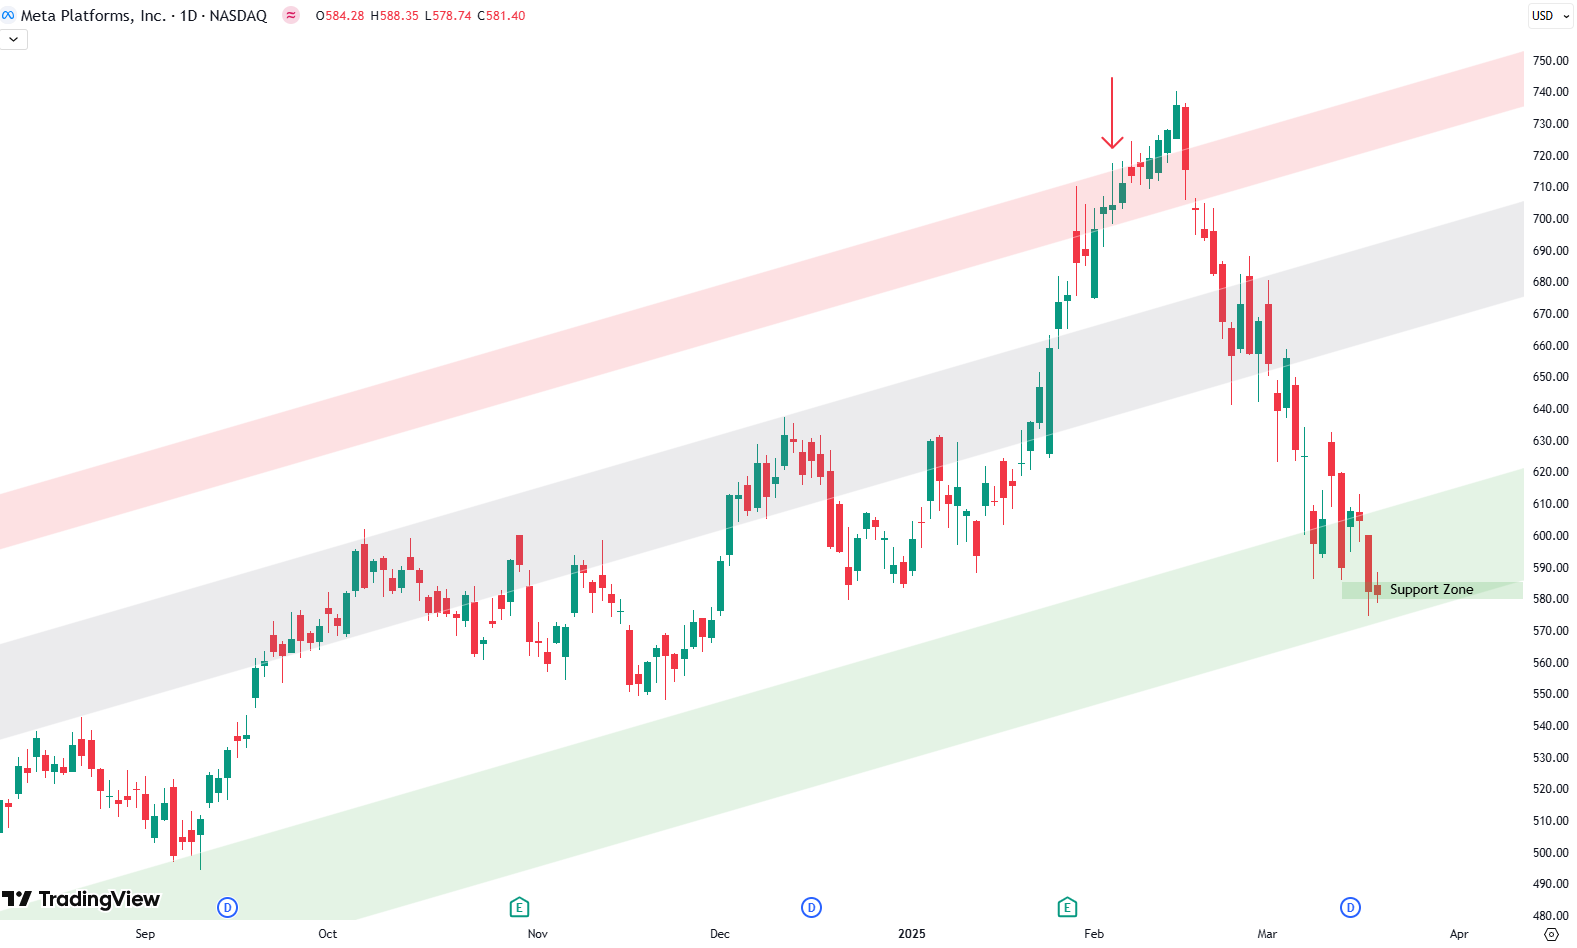
If you check out the weekly chart, you’ll notice a very clean trend channel with three distinct zones: green at the bottom, gray in the middle, and red at the top. These areas have played an important role in how Meta’s price has moved over time. The green shaded area has repeatedly acted as a support level, leading to strong rebounds. Meanwhile, the red shaded area has acted as resistance, capping the stock’s advances.
A few weeks ago, it looked like Meta was ready to push beyond the upper red zone. However, that didn’t happen. Instead, Meta reversed sharply, kicking off a significant decline that has brought it right back to the lower green support area.

Want to know the best time to invest in the Meta? Join our community of smart do-it-yourself investors who are making informed decisions with our expert insights, just by signing up with your email!
Premium Guide
Advanced Investing Signals
Basic Guide
Basic Investing
Signals
Simple Guide
Selected
Signals
Get started today with our free financial guide! Just enter your email, and you’ll start receiving our most popular Simple Guide with exclusive market signals right in your inbox.
The Warning Signal and the Drop That Followed
On February 6th, we noted that Meta was overbought and trading in the red shaded area. This was a warning sign that upside potential was limited and a pullback was likely. Sure enough, just seven or eight days later, the decline started. However, what we didn’t anticipate was how steep and aggressive the sell-off would be.
Meta has dropped about 22% from its recent highs, slicing right through the gray shaded area. This zone didn’t offer much support—there were only a couple of days where prices tried to stabilize, but they ultimately broke lower. Now, Meta is testing the bottom of the trend channel, making this a very interesting level to watch.
What’s Next? Bounce or Breakdown?
Now, let’s get into the daily chart, where we can see how the price action Right now, Meta is sitting in the green shaded area, which has historically acted as a strong support level. There are a couple of factors that could help the stock rebound here. First, we have the trendline support from the weekly chart. Second, there is a horizontal support level right at this price, which could give Meta an extra boost.
That said, there’s reason to be cautious. The recent decline hasn’t been a slow, choppy pullback—it’s been a sharp, impulsive drop. Typically, a move like this suggests that any bounce may be temporary, possibly just a retracement back to the gray shaded area before another leg lower.
If you’re considering adding back to your position, it might make sense to do so cautiously. While the support is there, it’s still unclear if this is just a short-term bounce or the start of a stronger recovery.
The next few weeks will be key in determining whether Meta finds support here or continues lower. If this trendline holds, we could see a move higher. If not, things could get even more interesting.
We’ll continue to monitor Meta closely and provide updates on how this plays out. For now, all eyes are on this key support level to see whether it can hold once again.
If you want to stay ahead of moves like this, you can get expert insights straight to your inbox—just drop your email for market updates and trade signals.
Microsoft has followed a predictable pattern for years, and right now, we’re at a moment where things could turn around again. Whether you’re looking to enter or just tracking the market, this is a key level to watch.
The world of finance can be complex, with many technical terms. For explanations of financial terminology, try using the Investopedia dictionary.
Schreibe einen Kommentar