
Welcome to our weekly newsletter on the S&P 500!
This week was a rough one for the S&P 500, with the index losing 2.5% overall. Monday’s dramatic drop of nearly 3% set the tone, followed by choppy movement on Tuesday and Wednesday, another dip on Thursday, and some recovery on Friday.
Looking at the 4-hour chart, where each candle represents four hours, we can see that on Monday, the price broke through the support zone we discussed last week. After dropping below it, the market retested this level from below, meaning it’s now acting as resistance instead of support.

We can also see the green trend lines from last week’s chart. These downward-sloping trend lines usually act as resistance, limiting any upward movement. However, this week, the market didn’t even test these trend lines, except for a small attempt on Friday. The downward momentum accelerated slightly during the week, but with Friday’s recovery we can be somewhat optimistic for next week.
Our last trade on the S&P 500 was back in November. Since then, the market hasn’t produced any clear signals, so we stayed on the sidelines. Looking at how the S&P 500 has been moving—up and down with no clear direction—this decision served us well.
Our last position, which we placed on November 20, has been active until December 10, when we sold it for a gain of 5.7%
Are you wondering when to buy the S&P 500 as an investor? Join our community of smart do-it-yourself investors who are making informed decisions with our expert insights, just by signing up with your email!
Premium Guide
Advanced Investing Signals
Basic Guide
Basic Investing
Signals
Simple Guide
Selected
Signals
Get started today with our free financial guide! Just enter your email, and you’ll start receiving our most popular Simple Guide with exclusive market signals right in your inbox.
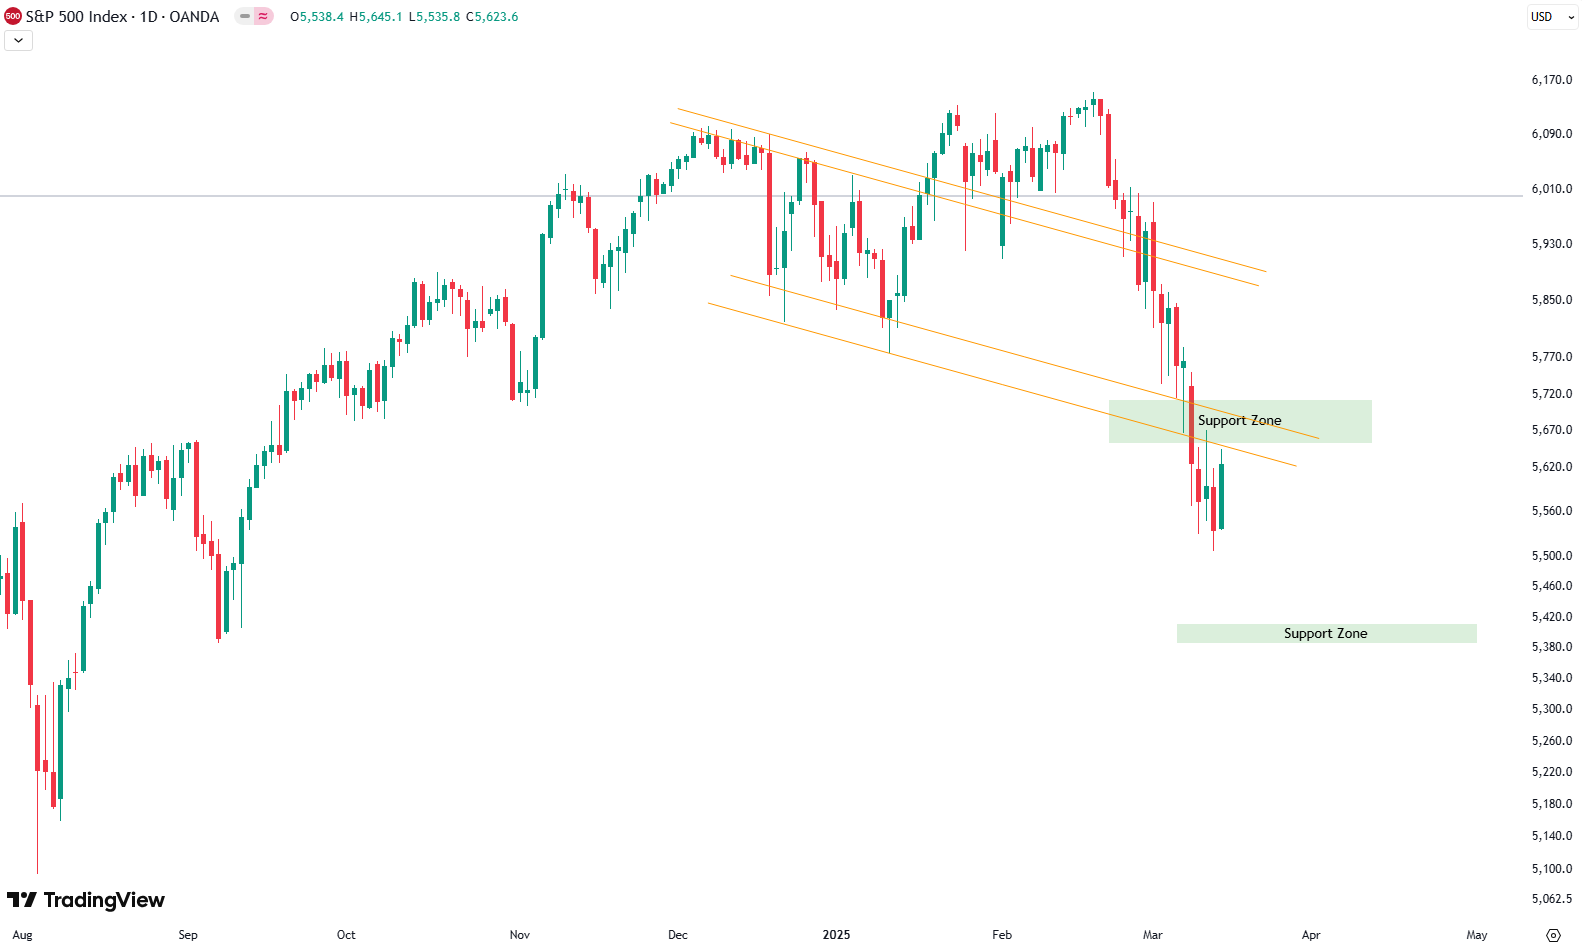
A Concerning Picture on the Daily Chart
Switching to the daily chart, things look more concerning. The decline has been steep, with the price breaking through key support zones and also dropping below the orange downward-sloping trend line we discussed last week.
Last week, I pointed out that the S&P 500 was overbought, sitting outside the two standard deviation Bollinger Bands, while the RSI was around 30. Now, these signals have strengthened even more—we are well below 30 on the RSI, and we’re still trading outside the lower Bollinger Band.
These extreme conditions can’t last forever. I originally expected a bounce earlier, but it didn’t happen. However, at this point, I would expect a bounce next week. We may have seen the start of it this Friday.
Looking at horizontal support levels, the next major support zone is further down at around 5,400 points, which is another 3.7% lower from current levels. That’s quite a bit of room to fall before we hit the next strong area of support. This level is marked by the lower green support zone box on the chart.
The Bigger Picture: Long-Term Trend Holding?
Now, let’s zoom out to the monthly chart (where each candle represents one month). This chart goes back to 2007, showing a well-established trend channel with green, red, and gray shaded areas as trend lines.

Historically, we have always found support in the lower green area of this trend channel and resistance at the top. However, after the sharp drop over the past few weeks, we have now entered the gray shaded area. Looking at past trends, this zone has often provided support after declines. Testing it now is actually quite encouraging.
On the weekly chart, if we start from the October 2022 low, we can draw another upward-sloping trend channel that has been in place for the past two years. This short-term channel also has green, gray, and red shaded areas, representing different trend levels.

Right now, the market is testing the lower green trend line of this short-term trend channel, while also sitting at the lower part of the gray shaded area from the long-term trend channel (since 2007).
This makes the current level extremely important. Given how oversold the daily chart is, we might see a bounce from here. The big question is whether this will be a sustainable recovery leading to new all-time highs, or just a dead cat bounce, where we make a lower high before dropping further.
Either way, next week will be crucial, and we will be watching closely.
For subscribers it is very important to follow our risk management measures that we provide with all our services to protect against losses in case support zones break
Stay ahead of the market! Sign up for our weekly updates and get expert insights on the S&P 500, key support levels, and market trends.
S&P 500: Seasonality Insights for Early 2025
Seasonality charts often provide helpful context for understanding market tendencies. Historically, the S&P 500 exhibits a choppy start to the year, with January and February experiencing turbulence that can extend into mid-March. This seasonal pattern suggests the potential for weakness in the coming weeks.
However, this type of analysis should always be approached cautiously. While seasonal trends indicate broad expectations, they cannot predict the future. Notably, last year saw significant deviations from typical patterns, with strength in the market that outpaced historical norms.
If seasonality holds true, this early choppiness might be followed by stabilization. Still, after the notable price increases seen in late 2024, investors should prepare for possible volatility and ensure proper risk management strategies are in place.
Ultimately, seasonal trends provide valuable context, but they must be considered alongside current market dynamics and technical analysis for a clearer picture. The S&P 500’s behavior during this critical time will reveal whether the seasonal weakness manifests or if the market defies expectations again.

Track Market Risk with Our Dashboard
Unser Markt-Dashboard bietet einen schnellen Überblick über die aktuellen Marktbedingungen und, was noch wichtiger ist, das damit verbundene Risiko. Unten sehen sie ein Chart eines unserer Tools, des Risiko-Level-Indikators. Es zeigt das prognostizierte Risiko von 1998 bis 2024. Wenn Sie interessiert sind, können Sie hier unsere Dashboard-Seite besuchen..

Die Welt der Finanzen ist komplex und umfasst viele Fachbegriffe. Für die Erklärung dieser Begriffe empfehle ich das Lexikon von Investopedia. Investopedia dictionary.
Schreibe einen Kommentar