
Microsoft’s stock is currently at an interesting turning point, and if you’ve been following its journey, this could be a big moment. Let’s break it down in a way that makes sense, even if you’re just starting out with investing.
Microsoft’s Long-Term Trend: Still on Track?
Looking at the monthly chart, we see Microsoft has been following a well-defined trend channel since 2007. This channel is framed by two green trend lines at the bottom, acting as support, and a red trend line at the top, acting as resistance. Each time Microsoft has tested these levels, it has reacted accordingly.

The last time it hit the upper resistance was in 2021, leading to a correction that found support in the lower gray-shaded zone in late 2022. Since then, the stock has moved upwards but is now nearing the lower gray area again.
So, what does this mean? Historically, this area has been a key support level, which could lead to another bounce.
Want to know the best time to invest in the Microsoft? Join our community of smart do-it-yourself investors who are making informed decisions with our expert insights, just by signing up with your email!
Premium Guide
Advanced Investing Signals
Basic Guide
Basic Investing
Signals
Simple Guide
Selected
Signals
Get started today with our free financial guide! Just enter your email, and you’ll start receiving our most popular Simple Guide with exclusive market signals right in your inbox.
Zooming Into the Weekly Chart
Now, shifting to the weekly chart, things get even more interesting. The last two times Microsoft approached this gray zone, it didn’t just touch it—it made a deep dip before recovering. These moments are highlighted with red circles on the chart.

So, if history repeats itself, we could see another deep move before a rebound. This is something to watch closely because it could signal a buying opportunity if Microsoft finds support again.
Daily Chart: Short-Term Moves & What’s Next
Now, let’s get into the daily chart, where we can see how the price action has played out in more detail.
Back in December 2024, we talked about how Microsoft’s last few months of gains were part of a corrective move rather than a strong new uptrend. At that time, we noted that the support zone was crucial—if the stock held above it, the outlook would stay bullish.
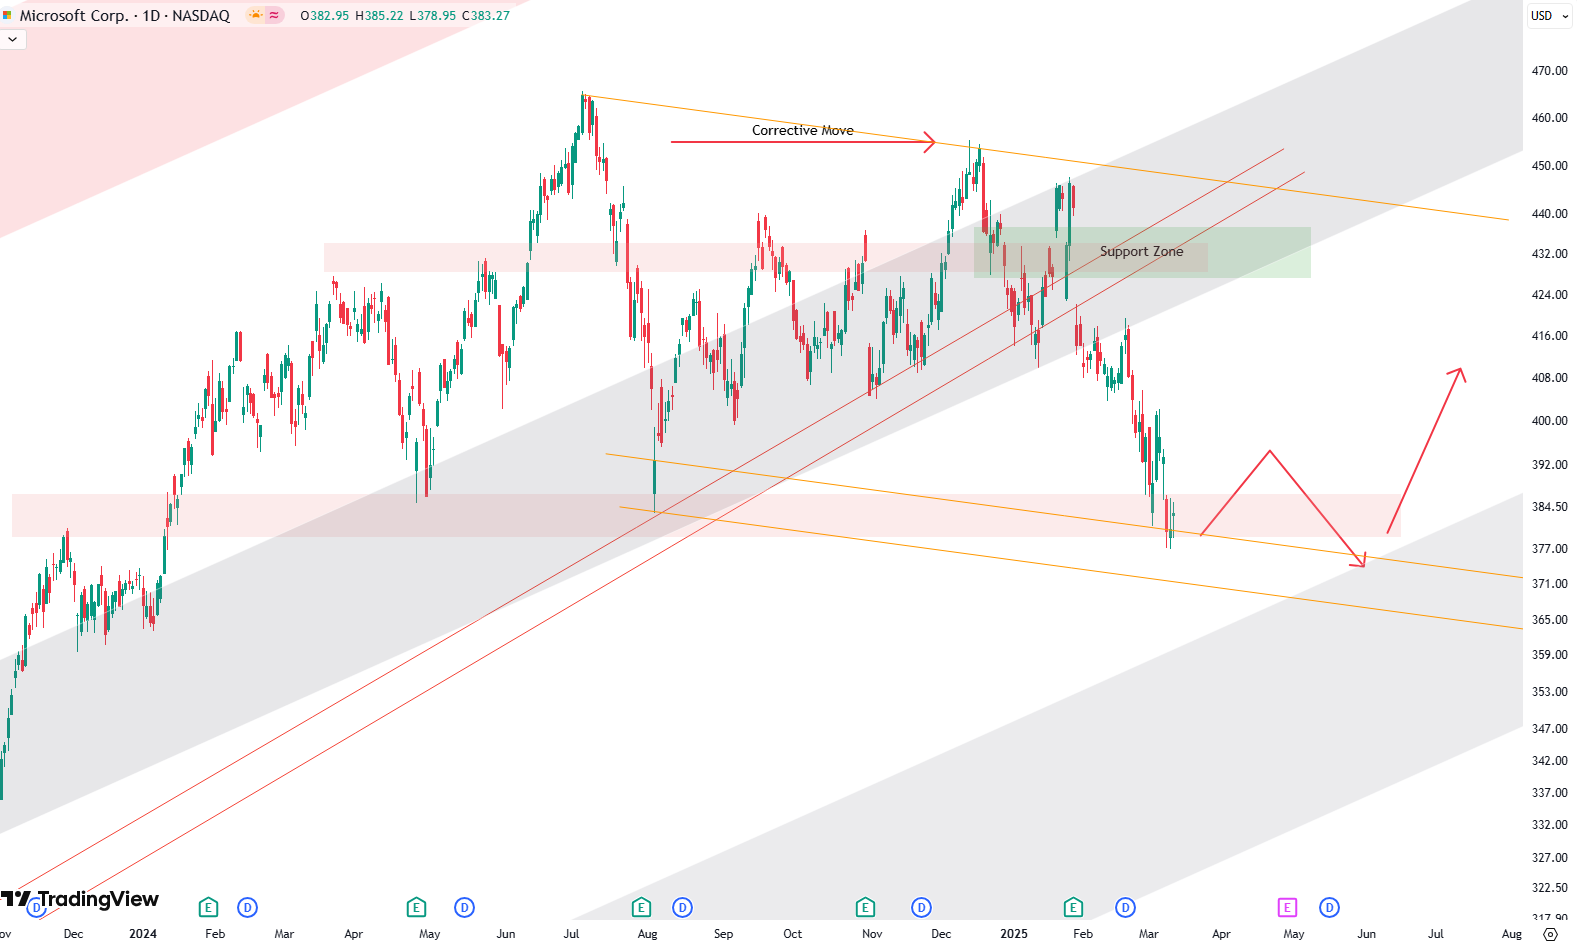
But Microsoft didn’t hold that support and has since dropped about 16%. Now, we’re seeing a convergence of several important support factors:
- The lower gray-shaded area from the larger trend
- A horizontal support zone from previous price action
- A downward-sloping orange trend channel
With all of these coming together, the likely scenario is a small bounce, followed by another move down into deeper support before a potential recovery. These movements are outlined in red arrows on the chart.
What This Means for Investors
The test of the gray support area will be critical. If Microsoft holds, it could mark the end of this correction and set the stage for a rally.
This correction has been in play since July 2024, and typically, long corrections lead to strong upside moves. The key now is patience—watching how the price reacts in this area.
If you want to stay ahead of moves like this, you can get expert insights straight to your inbox—just drop your email for market updates and trade signals.
Microsoft has followed a predictable pattern for years, and right now, we’re at a moment where things could turn around again. Whether you’re looking to enter or just tracking the market, this is a key level to watch.
The world of finance can be complex, with many technical terms. For explanations of financial terminology, try using the Investopedia dictionary.
Schreibe einen Kommentar