
This week, the S&P 500 had a loss of 1.1%.
The S&P 500 saw a sharp decline this week. Last week, we pointed out that the index had closed below the green trendline on the chart. At that time, we were still holding above the key 6,000-point support zone. However, this week, sellers took control, leading to a significant drop.
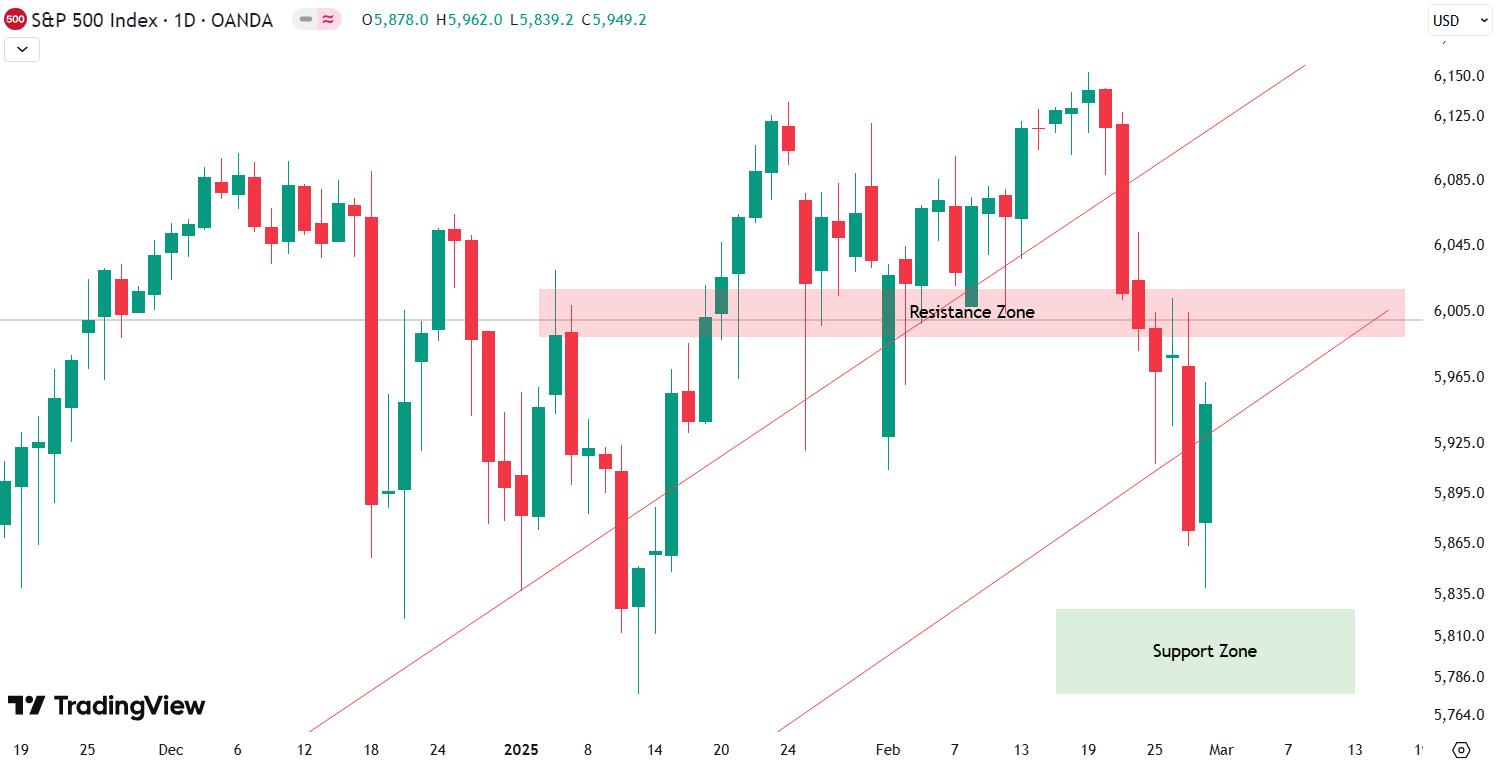
Looking at the chart, Monday and Tuesday were both down days. Wednesday saw a brief pause with some consolidation, but Thursday brought another big move lower—about 2% from peak to trough. While Friday saw a strong rally, the S&P 500 still closed well below 6,000 points.
Now, the next key support level to watch is around 5,800 points. Whether this area holds or breaks will likely shape the market’s next move.

Our last position, which we placed on November 20, has been active until December 10, when we sold it for a gain of 5.7%
Are you wondering when to buy the S&P 500 as an investor? Join our community of smart do-it-yourself investors who are making informed decisions with our expert insights, just by signing up with your email!
Premium Guide
Advanced Investing Signals
Basic Guide
Basic Investing
Signals
Simple Guide
Selected
Signals
Get started today with our free financial guide! Just enter your email, and you’ll start receiving our most popular Simple Guide with exclusive market signals right in your inbox.
S&P 500 Drops Below 6,000
Looking at the daily chart, the recent selloff is clear. The big red candle from last Friday marked the first major drop, followed by another sharp decline this Thursday. You can see that we have now moved below the 6,000-point level, which had been acting as strong support. That level will likely now serve as resistance.
With the market in an oversold condition in the short term, a bounce could be in store. We started to see this with Friday’s rally, which could continue into next week—potentially testing the 6,000-point level from below. The big question is whether the S&P 500 can reclaim it. If not, another move lower is possible.
The 6,000-point mark has been a key reference level for a while now. If we test it from below and fail to break back above, the risk of further downside increases, potentially leading to new lows below January’s low.

Additionally, Friday’s rally brought us back to two important red trendlines that had been acting as long-term support on the weekly chart. These trendlines, drawn using standard scaling, had been in place since October 2023, but they were broken earlier this week. While this is a concerning sign, the logarithmic chart offers a different perspective—it suggests we are now inside the gray-shaded area, a middle zone within the broader trend channel.

So far, this region has provided support, and we have some confluent signals from different trendlines. My key focus remains the 6,000-point level. If we get rejected from below, more downside is likely. But if we break back above, new all-time highs are still on the table.
The next couple of weeks will be crucial in determining whether this correction—ongoing since December—extends further or if it is already nearing an end.
For subscribers it is very important to follow our risk management measures that we provide with all our services to protect against losses in case support zones break
Stay ahead of the market! Sign up for our weekly updates and get expert insights on the S&P 500, key support levels, and market trends.
S&P 500: Seasonality Insights for Early 2025
Seasonality charts often provide helpful context for understanding market tendencies. Historically, the S&P 500 exhibits a choppy start to the year, with January and February experiencing turbulence that can extend into mid-March. This seasonal pattern suggests the potential for weakness in the coming weeks.
However, this type of analysis should always be approached cautiously. While seasonal trends indicate broad expectations, they cannot predict the future. Notably, last year saw significant deviations from typical patterns, with strength in the market that outpaced historical norms.
If seasonality holds true, this early choppiness might be followed by stabilization. Still, after the notable price increases seen in late 2024, investors should prepare for possible volatility and ensure proper risk management strategies are in place.
Ultimately, seasonal trends provide valuable context, but they must be considered alongside current market dynamics and technical analysis for a clearer picture. The S&P 500’s behavior during this critical time will reveal whether the seasonal weakness manifests or if the market defies expectations again.

Track Market Risk with Our Dashboard
Unser Markt-Dashboard bietet einen schnellen Überblick über die aktuellen Marktbedingungen und, was noch wichtiger ist, das damit verbundene Risiko. Unten sehen sie ein Chart eines unserer Tools, des Risiko-Level-Indikators. Es zeigt das prognostizierte Risiko von 1998 bis 2024. Wenn Sie interessiert sind, können Sie hier unsere Dashboard-Seite besuchen..

Die Welt der Finanzen ist komplex und umfasst viele Fachbegriffe. Für die Erklärung dieser Begriffe empfehle ich das Lexikon von Investopedia. Investopedia dictionary.
Schreibe einen Kommentar