
This week, the S&P 500 had another rollercoaster ride, ending with a 1.7% loss. Looking at the 4-hour chart, the market remained relatively stable for most of the week, moving sideways before a small drop on Thursday, a brief recovery, and a sharp sell-off on Friday.
As seen in the chart, the green support zone was broken along with key trend lines we discussed in last week’s analysis. These trend lines represented a short-term bullish structure, and with Friday’s drop, that setup has now collapsed.

Our last position, which we placed on November 20, has been active until December 10, when we sold it for a gain of 5.7%
Are you wondering when to buy the S&P 500 as an investor? Join our community of smart do-it-yourself investors who are making informed decisions with our expert insights, just by signing up with your email!
Premium Guide
Advanced Investing Signals
Basic Guide
Basic Investing
Signals
Simple Guide
Selected
Signals
Get started today with our free financial guide! Just enter your email, and you’ll start receiving our most popular Simple Guide with exclusive market signals right in your inbox.
Major Market Support at Risk
Zooming out to the daily chart, we can see the broader market development over the last few months. After a correction in December and January, the index made a strong move above 6,000 points and the lower support zone.
The 6,000 level was tested multiple times and held firm, signaling strength. However, last week’s rally looked promising—until Friday’s sell-off brought us right back into the lower support zone around 6,000 points.
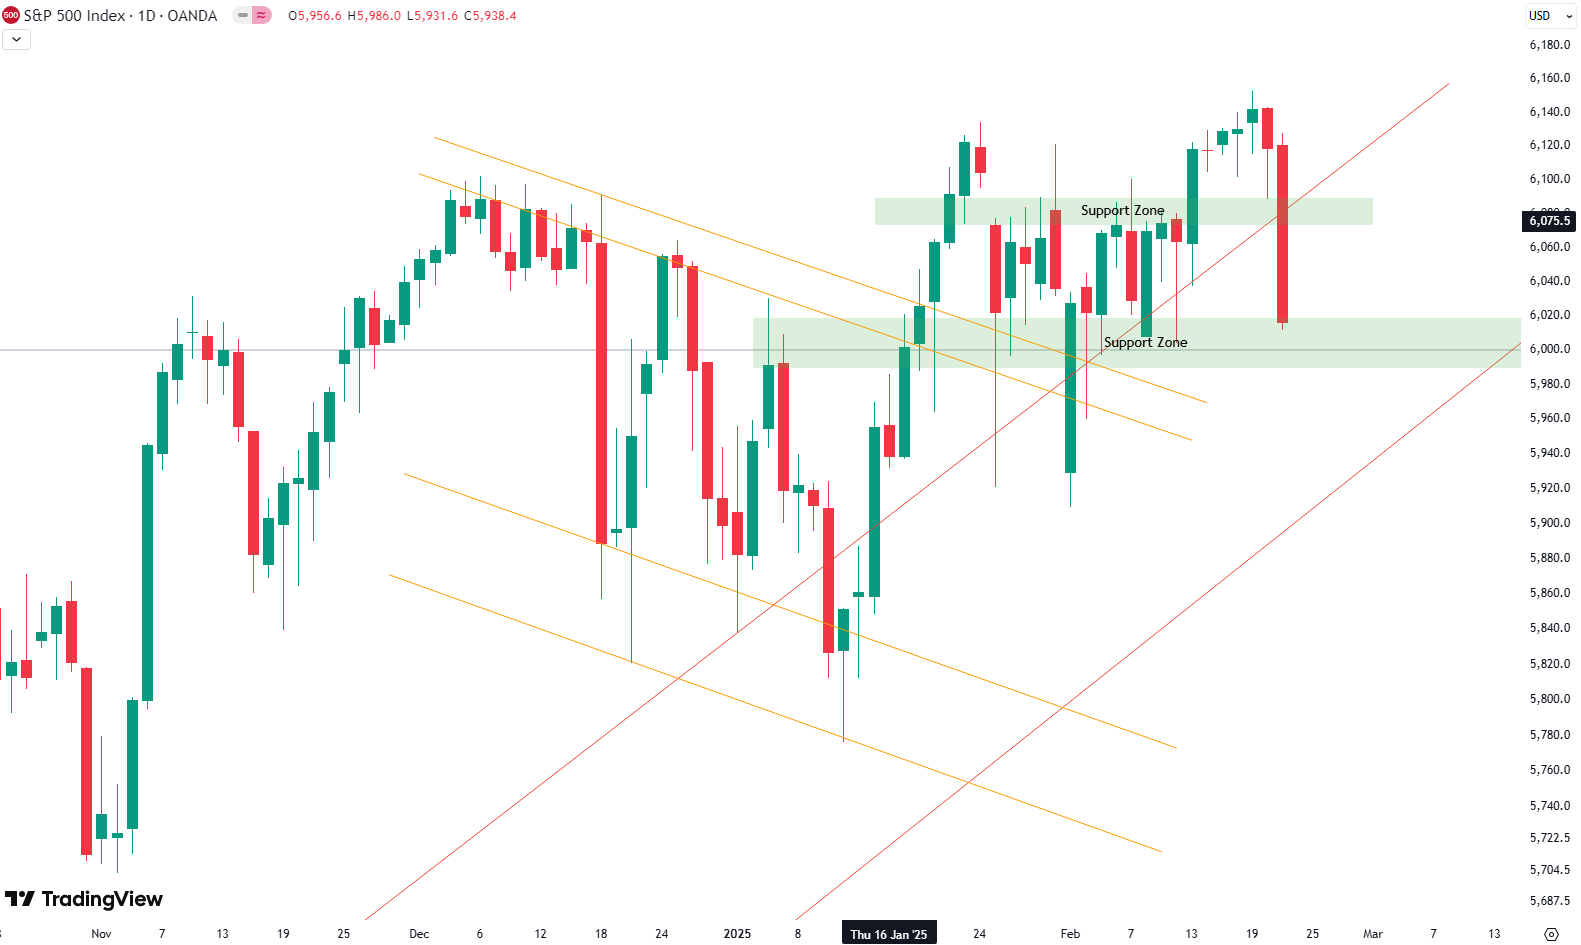
At this stage, holding the 6,000 level is critical. The short-term trend is already broken, and now the big question is: Will the larger trend hold?
This larger trend is defined by two red trend lines. Over the last few weeks, the S&P 500 has been stuck in a consolidation phase with choppy upward movement. Friday’s decline strengthens the argument that a topping pattern may be forming.
Could this just be a correction before another move higher? Possibly. But at the moment, we are seeing more weakness than strength in the market.
For now, we return to our key support level rules:
6,000 is the crucial level to watch
If it breaks, further downside is likely
The next few weeks will be critical in determining the next major move in the S&P 500.
For subscribers it is very important to follow our risk management measures that we provide with all our services to protect against losses in case support zones break
Stay ahead of the market! Sign up for our weekly updates and get expert insights on the S&P 500, key support levels, and market trends.
S&P 500: Seasonality Insights for Early 2025
Seasonality charts often provide helpful context for understanding market tendencies. Historically, the S&P 500 exhibits a choppy start to the year, with January and February experiencing turbulence that can extend into mid-March. This seasonal pattern suggests the potential for weakness in the coming weeks.
However, this type of analysis should always be approached cautiously. While seasonal trends indicate broad expectations, they cannot predict the future. Notably, last year saw significant deviations from typical patterns, with strength in the market that outpaced historical norms.
If seasonality holds true, this early choppiness might be followed by stabilization. Still, after the notable price increases seen in late 2024, investors should prepare for possible volatility and ensure proper risk management strategies are in place.
Ultimately, seasonal trends provide valuable context, but they must be considered alongside current market dynamics and technical analysis for a clearer picture. The S&P 500’s behavior during this critical time will reveal whether the seasonal weakness manifests or if the market defies expectations again.

Track Market Risk with Our Dashboard
Unser Markt-Dashboard bietet einen schnellen Überblick über die aktuellen Marktbedingungen und, was noch wichtiger ist, das damit verbundene Risiko. Unten sehen sie ein Chart eines unserer Tools, des Risiko-Level-Indikators. Es zeigt das prognostizierte Risiko von 1998 bis 2024. Wenn Sie interessiert sind, können Sie hier unsere Dashboard-Seite besuchen..

Die Welt der Finanzen ist komplex und umfasst viele Fachbegriffe. Für die Erklärung dieser Begriffe empfehle ich das Lexikon von Investopedia. Investopedia dictionary.
Schreibe einen Kommentar