
Gold has been on an incredible run, and if you’ve been watching the charts, you know it’s been climbing steadily. But the big question now is: Can gold break the crucial $3,000 mark, or is a correction just around the corner?
Gold’s Long-Term Climb – A Look at the Monthly Chart
Taking a step back, the monthly chart shows gold’s journey since 2001. Over this period, it has surged by 800%, an impressive move for any asset. The chart reveals a clear pattern: gold tends to respect certain parallel trend lines, bouncing off support and encountering resistance at key levels.
The green zone at the bottom has historically provided strong support, while the red zone at the top has acted as resistance, most notably around 2011 when gold peaked before correcting. Right now, we’re seeing gold push higher again, and it’s approaching a significant resistance zone.

Since October 2023, gold has been on a strong uptrend, rapidly climbing toward $3,000, a crucial psychological level. This rally is exciting, but also raises the question—how much further can it go before hitting resistance?
Want to know the best time to invest in Gold? Join our community of smart do-it-yourself investors who are making informed decisions with our expert insights, just by signing up with your email!
Premium Guide
Advanced Investing Signals
Basic Guide
Basic Investing
Signals
Simple Guide
Selected
Signals
Get started today with our free financial guide! Just enter your email, and you’ll start receiving our most popular Simple Guide with exclusive market signals right in your inbox.
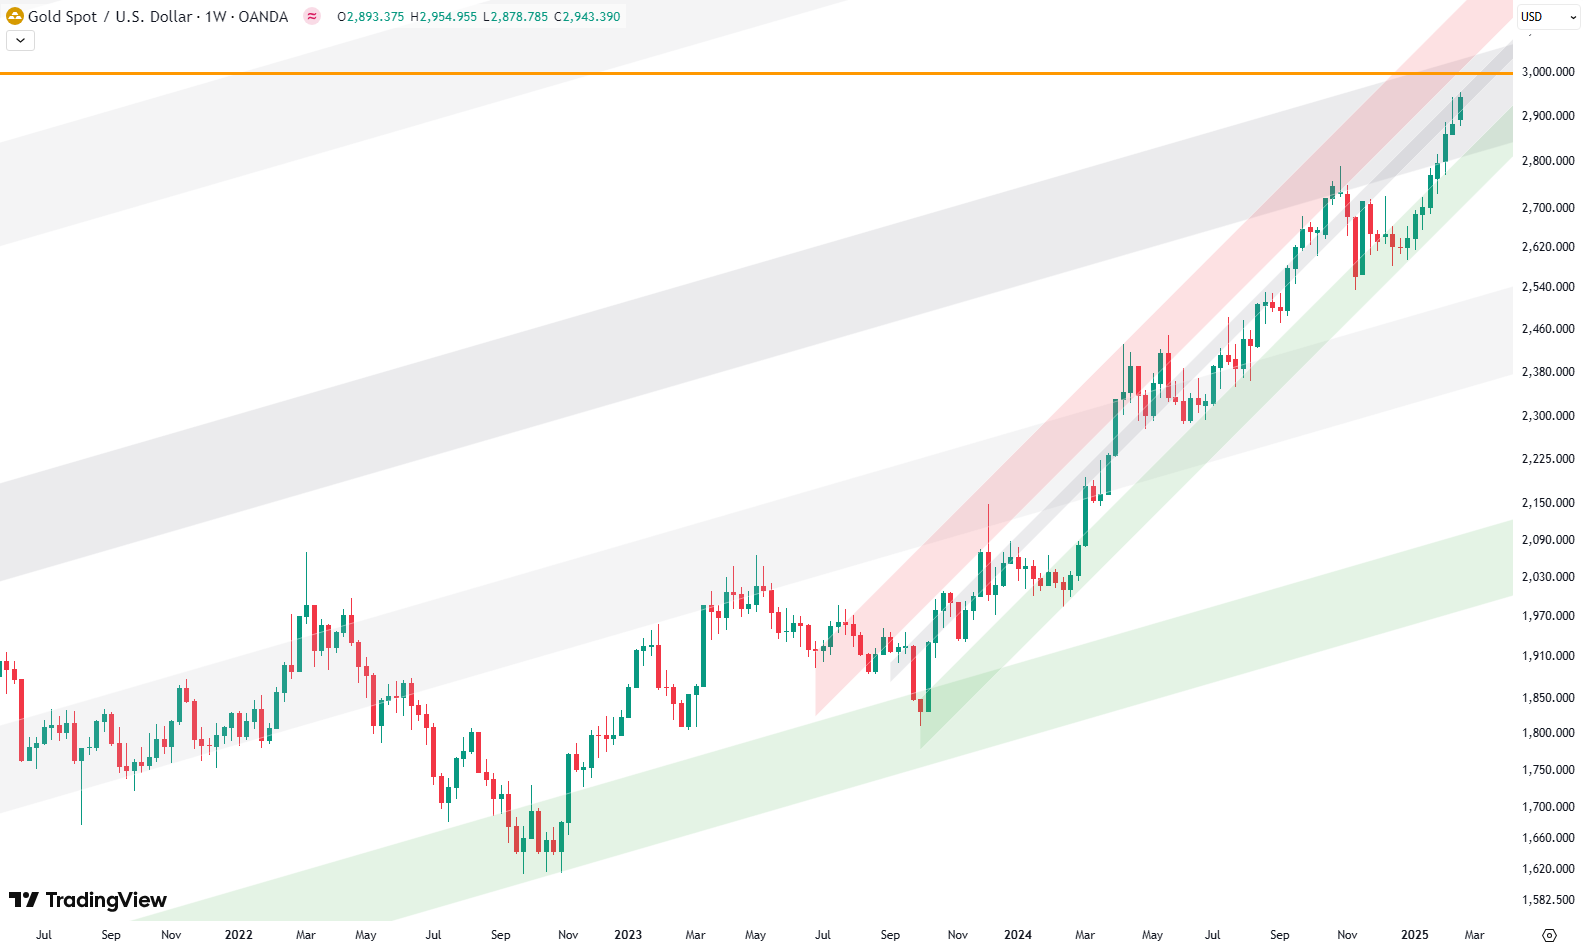
Zooming In – What the Weekly Chart Tells Us
The weekly chart gives us a closer look at gold’s recent movement. The uptrend since late 2023 has been remarkable, but it’s also getting stretched. We’re now outside the weekly and monthly Bollinger Bands, which signals that gold is overextended. Historically, when gold moves outside these bands, we often see a pullback or consolidation.
Another key factor? The price is nearing two critical resistance zones:
The gray shaded area on the weekly chart – a mid-point balance level in the recent uptrend.
The gray shaded area on the monthly chart – a larger resistance zone that has influenced gold’s long-term movement.
With these two resistance areas aligning and the $3,000 mark approaching, it wouldn’t be surprising to see some profit-taking and a correction in the coming months.
What’s Next for Gold?
While gold could push past $3,000, the rally looks stretched. Markets don’t move in straight lines forever, and at some point, a pullback is natural. Given that multiple indicators are lining up, this might be a good time to take some profits, especially if you’ve been riding the rally since lower levels.
This doesn’t mean selling everything—just something to consider if you want to buy back at lower prices when the next correction comes. Gold’s long-term trend remains strong, but a short-term cooldown wouldn’t be a surprise.
How far can gold go before a pullback? If you want deeper insights and expert signals, simply enter your email to get updates from the pros.
For now, we wait and see. The next few weeks will be critical in determining whether gold continues its historic rise—or if it finally takes a breather.
The world of finance can be complex, with many technical terms. For explanations of financial terminology, try using the Investopedia dictionary.
Schreibe einen Kommentar