
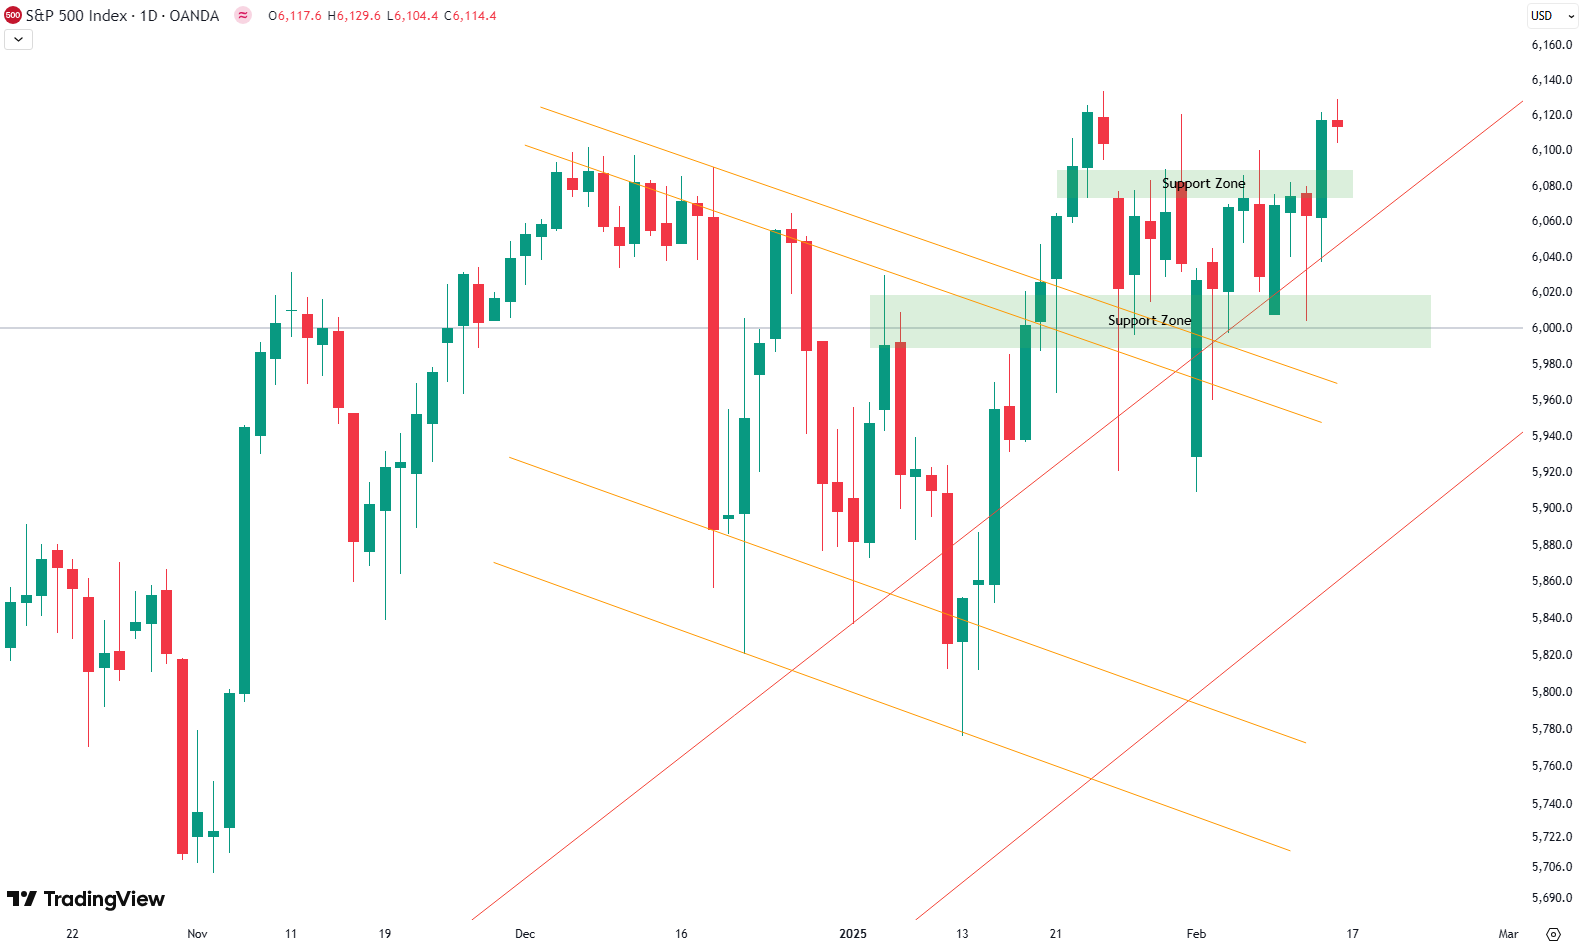
This week, the S&P 500 gained 1.5%, showing strength after weeks of consolidation. As seen in the chart, the 4-hour timeframe highlights increased volatility, with price swings in both directions. Instead of a clear correction to the downside, the market has been moving sideways, building a base around the 6,000-point mark, which has repeatedly acted as strong support.
Additionally, we can now draw two green trend lines, indicating an upward trend that has held steady so far. This trend line originates from the mid-January low, was tested again at the end of January, and once more this Wednesday, each time leading to a strong bounce.
For now, this rising trend line provides a useful reference for tracking market direction. If it breaks, it could serve as an early warning that momentum is shifting.

Our last position, which we placed on November 20, has been active until December 10, when we sold it for a gain of 5.7%
Are you wondering when to buy the S&P 500 as an investor? Join our community of smart do-it-yourself investors who are making informed decisions with our expert insights, just by signing up with your email!
Premium Guide
Advanced Investing Signals
Basic Guide
Basic Investing
Signals
Simple Guide
Selected
Signals
Get started today with our free financial guide! Just enter your email, and you’ll start receiving our most popular Simple Guide with exclusive market signals right in your inbox.
Is the Market Finally Breaking Out?
Looking at the daily chart, we can see that the 6,000-point level has been a crucial area of support, with multiple rallies pushing prices higher. Over the past three weeks, however, an upper resistance zone around 6,080 points formed, acting as a ceiling for further gains.
As seen in the chart, this week brought a significant breakout above resistance on Thursday. If this breakout holds, the 6,080 level should now act as support rather than resistance. A retest of this zone next week wouldn’t be surprising, as the market often confirms support levels before moving higher.
Now, the key is whether the market can maintain its momentum. As mentioned in previous updates, the market needs to continue pushing higher with steady gains. If prices stall and fall back into the choppy sideways range, it could be a sign of underlying weakness.
For subscribers, it is very important to follow our risk management measures that we provide with all our services to protect against losses in case support zones break. Get full access to our insights by simply entering your email. Having these updates delivered straight to your inbox ensures you never miss crucial market movements.
S&P 500: Seasonality Insights for Early 2025
Seasonality charts often provide helpful context for understanding market tendencies. Historically, the S&P 500 exhibits a choppy start to the year, with January and February experiencing turbulence that can extend into mid-March. This seasonal pattern suggests the potential for weakness in the coming weeks.
However, this type of analysis should always be approached cautiously. While seasonal trends indicate broad expectations, they cannot predict the future. Notably, last year saw significant deviations from typical patterns, with strength in the market that outpaced historical norms.
If seasonality holds true, this early choppiness might be followed by stabilization. Still, after the notable price increases seen in late 2024, investors should prepare for possible volatility and ensure proper risk management strategies are in place.
Ultimately, seasonal trends provide valuable context, but they must be considered alongside current market dynamics and technical analysis for a clearer picture. The S&P 500’s behavior during this critical time will reveal whether the seasonal weakness manifests or if the market defies expectations again.

Track Market Risk with Our Dashboard
Unser Markt-Dashboard bietet einen schnellen Überblick über die aktuellen Marktbedingungen und, was noch wichtiger ist, das damit verbundene Risiko. Unten sehen sie ein Chart eines unserer Tools, des Risiko-Level-Indikators. Es zeigt das prognostizierte Risiko von 1998 bis 2024. Wenn Sie interessiert sind, können Sie hier unsere Dashboard-Seite besuchen..

Die Welt der Finanzen ist komplex und umfasst viele Fachbegriffe. Für die Erklärung dieser Begriffe empfehle ich das Lexikon von Investopedia. Investopedia dictionary.
Schreibe einen Kommentar