
This week, NVIDIA is making headlines, and not just because of its impressive run in the stock market. A shock from China has raised some big questions about the company’s future. A new AI model, DeepSeek, has entered the scene and is reportedly delivering results comparable to other AI, but at a much lower cost. If AI advancements no longer require such expensive hardware, NVIDIA’s dominance in the AI chip market could face some serious challenges.
Now, let’s dive into the charts and see what they’re telling us.
A Clear Long-Term Uptrend, But Are We Hitting Resistance?
Looking at NVIDIA’s 12-year logarithmic chart, there’s an unmistakable long-term uptrend. The stock has been moving within a well-defined rising channel. The lower green-shaded area has acted as strong support every time prices dipped, while the upper red-shaded zone has consistently provided resistance. In the middle, there’s a gray trendline that sometimes acts as support and other times as resistance.

Right now, NVIDIA is sitting in the red-shaded area, which historically signals that the upside might be limited. Every time the stock reached this zone, it struggled to break through and often saw a pullback. Could we be looking at another correction?
Sie fragen sich, wann Sie als Investor Nvidia kaufen sollten? Entdecken Sie unsere maßgeschneiderten Dienstleistungen und schließen Sie sich unserer wachsenden Gemeinschaft von Do-it-yourself-Investoren an, die sich mit unserer Anleitung erfolgreich auf dem Markt zurechtgefunden haben.
Premium Guide
Advanced Investing Signals
Basic Guide
Basic Investing
Signals
Simple Guide
Selected
Signals
Congratulations! You’ve discovered your new free financial guide. Sign up for our most popular service, the Simple Guide.
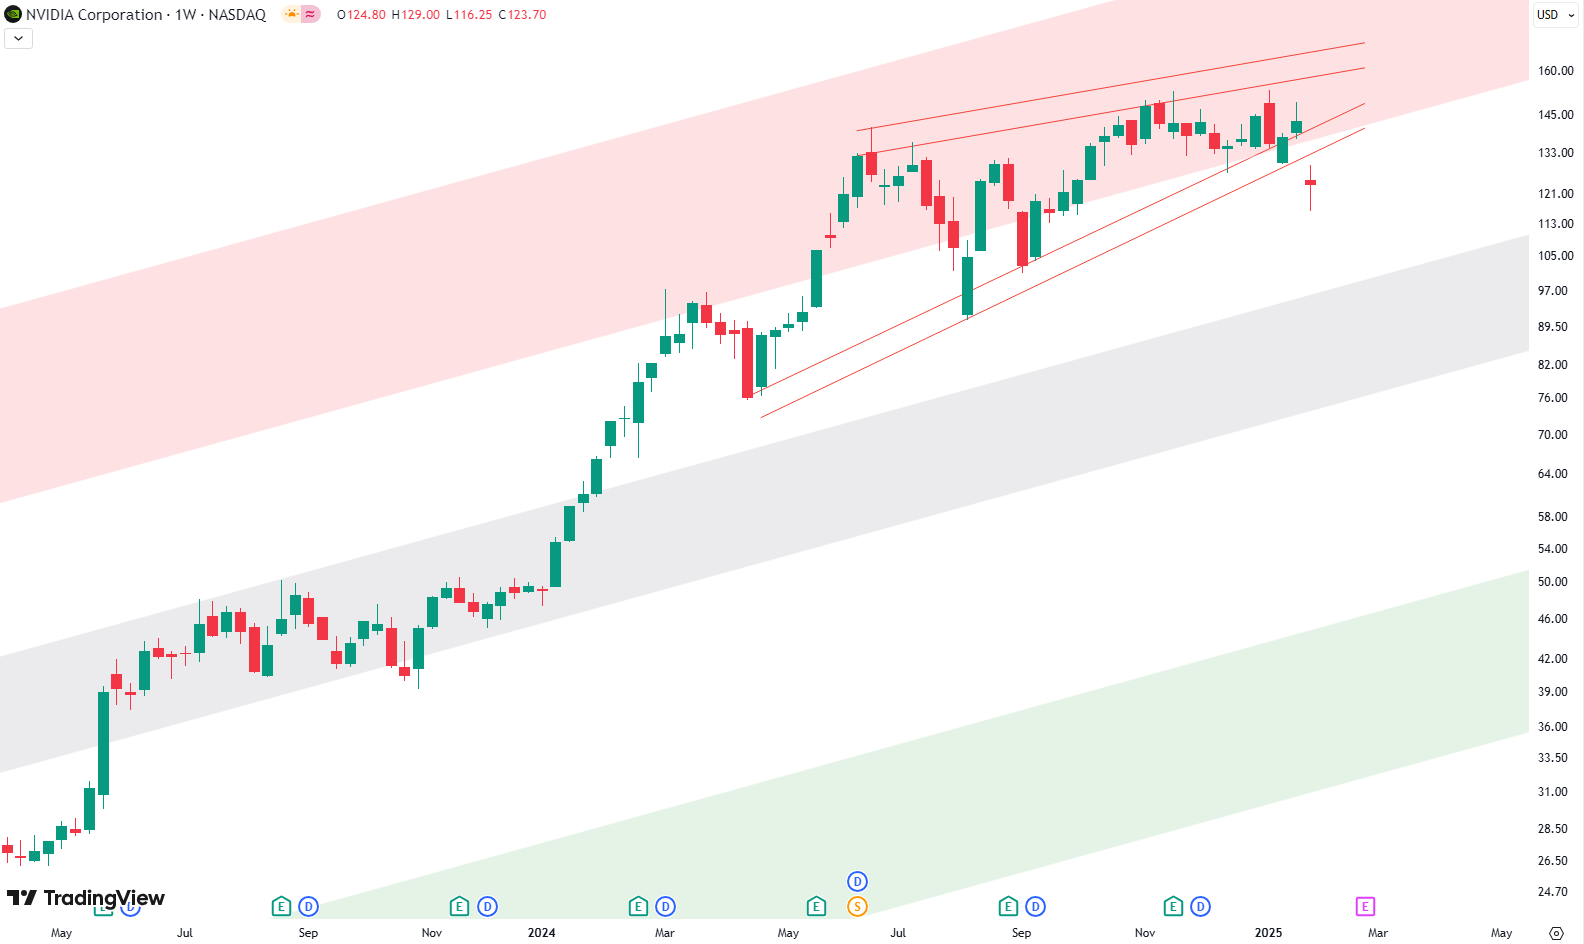
The Weekly Chart Shows a Bearish Pattern
Zooming into the weekly chart, things start to look a bit concerning. Within the red-shaded resistance area, NVIDIA has formed a rising wedge pattern. This is a classic bearish setup—typically signaling that prices might drop after a period of steady gains.
The last candle on the chart is particularly interesting. While the week isn’t over yet, it shows that NVIDIA has broken below the wedge pattern. If this breakdown holds, we could see a retest of the wedge from below before the stock continues downward.
A Potential 30% Drop?
If NVIDIA follows this technical setup, the next major support level is near the gray trendline, which is roughly 30% below the current price. That’s a big potential correction. While nothing is guaranteed, the combination of fundamental risks (AI developments may reducing demand for high-end hardware) and bearish technical patterns makes this scenario worth considering.
Final Thoughts
NVIDIA has had an incredible run, but no stock moves up in a straight line forever. Right now, the technical charts are signaling caution. If the stock struggles to hold the rising wedge, we could be in for a significant pullback. Whether this turns into a buying opportunity or a longer-term shift in NVIDIA’s dominance remains to be seen, but for now, it’s a moment to watch closely.
The world of finance can be complex, with many technical terms. For explanations of financial terminology, try using the Investopedia dictionary.
Schreibe einen Kommentar