
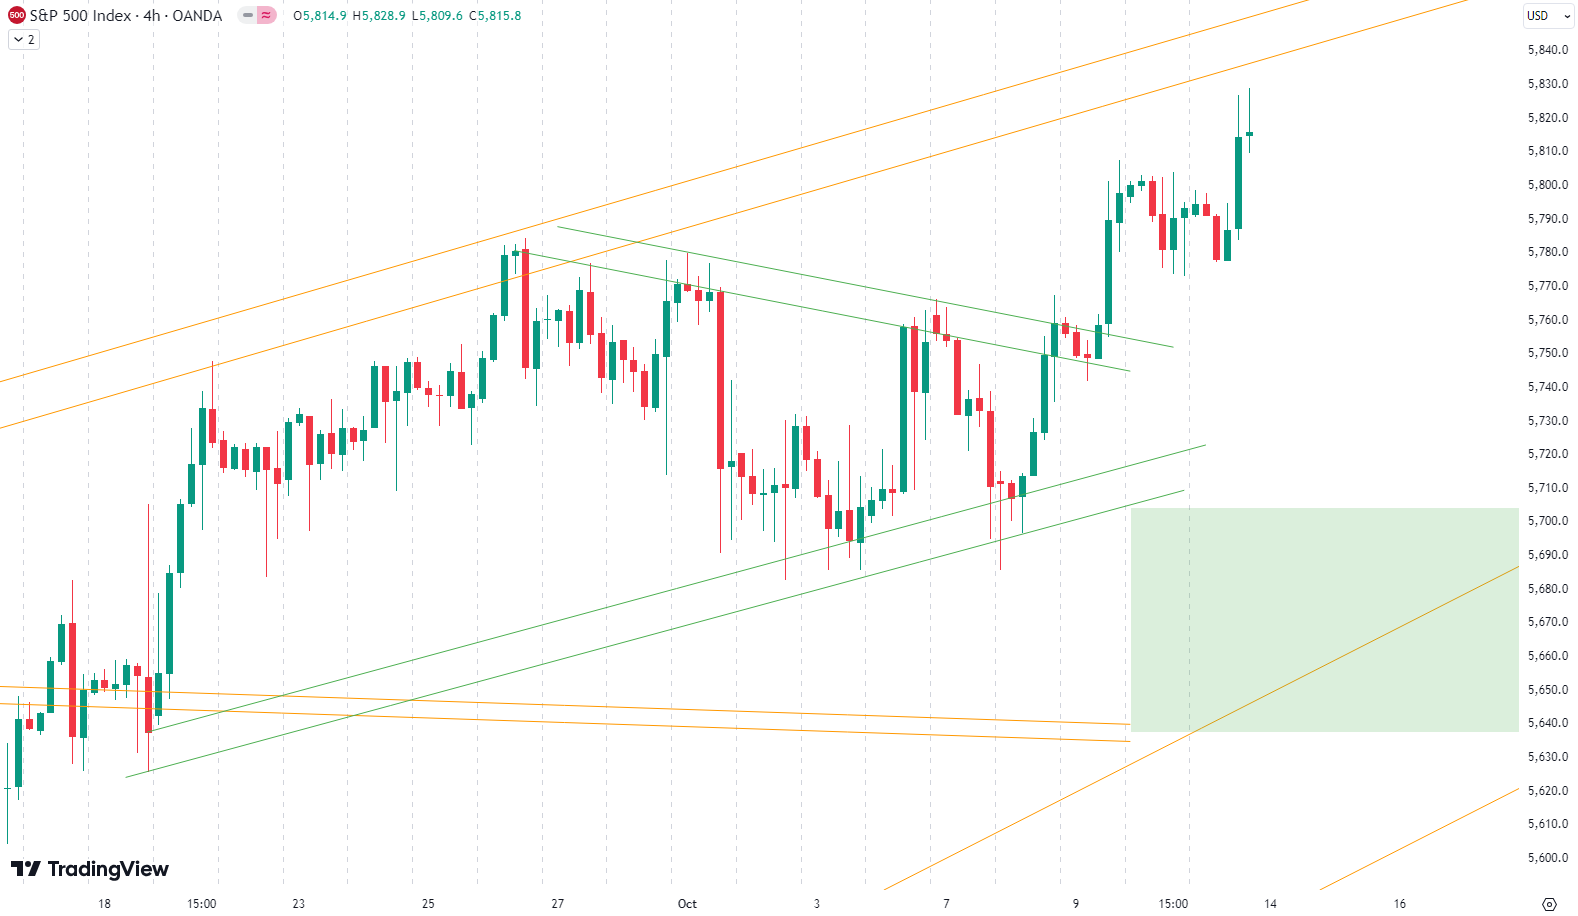
Welcome to our weekly newsletter on the S&P 500! This week, the S&P 500 saw a solid gain of 1.1%, reflecting strong momentum in the market. Looking at the 4-hour chart, the index has been forming a wedge pattern since early October. This pattern, shown by the green trend lines, indicates some corrective sideways action.
On Monday and Tuesday, the S&P 500 tested the downside of this wedge, but it managed to bounce back, breaking out on the upside. After a brief retest, it continued its upward move. It’s common to see these kinds of breakouts, even in smaller time frames like this one. If you’re following market movements, keep an eye on how the wedge patterns evolve, as they often set the stage for bigger market shifts.
Our last position, which we placed on August 8th, has been active until September 5th, when we sold it for a gain of 7.7%
Sie fragen sich, wann Sie als Investor den S&P 500 kaufen sollten? Entdecken Sie unsere maßgeschneiderten Dienstleistungen und schließen Sie sich unserer wachsenden Gemeinschaft von Do-it-yourself-Investoren an, die sich mit unserer Anleitung erfolgreich auf dem Markt zurechtgefunden haben.
Premium Guide
Advanced Investing Signals
139€ / Monat
Basic Guide
Basic Investing
Signals
49€ / Monat
Simple Guide
Selected
Signals
Kostenfrei
Congratulations! You’ve discovered your new free financial guide. Simply sign up for our most popular service, our Simple Guide.
Risk of Pullback Looms
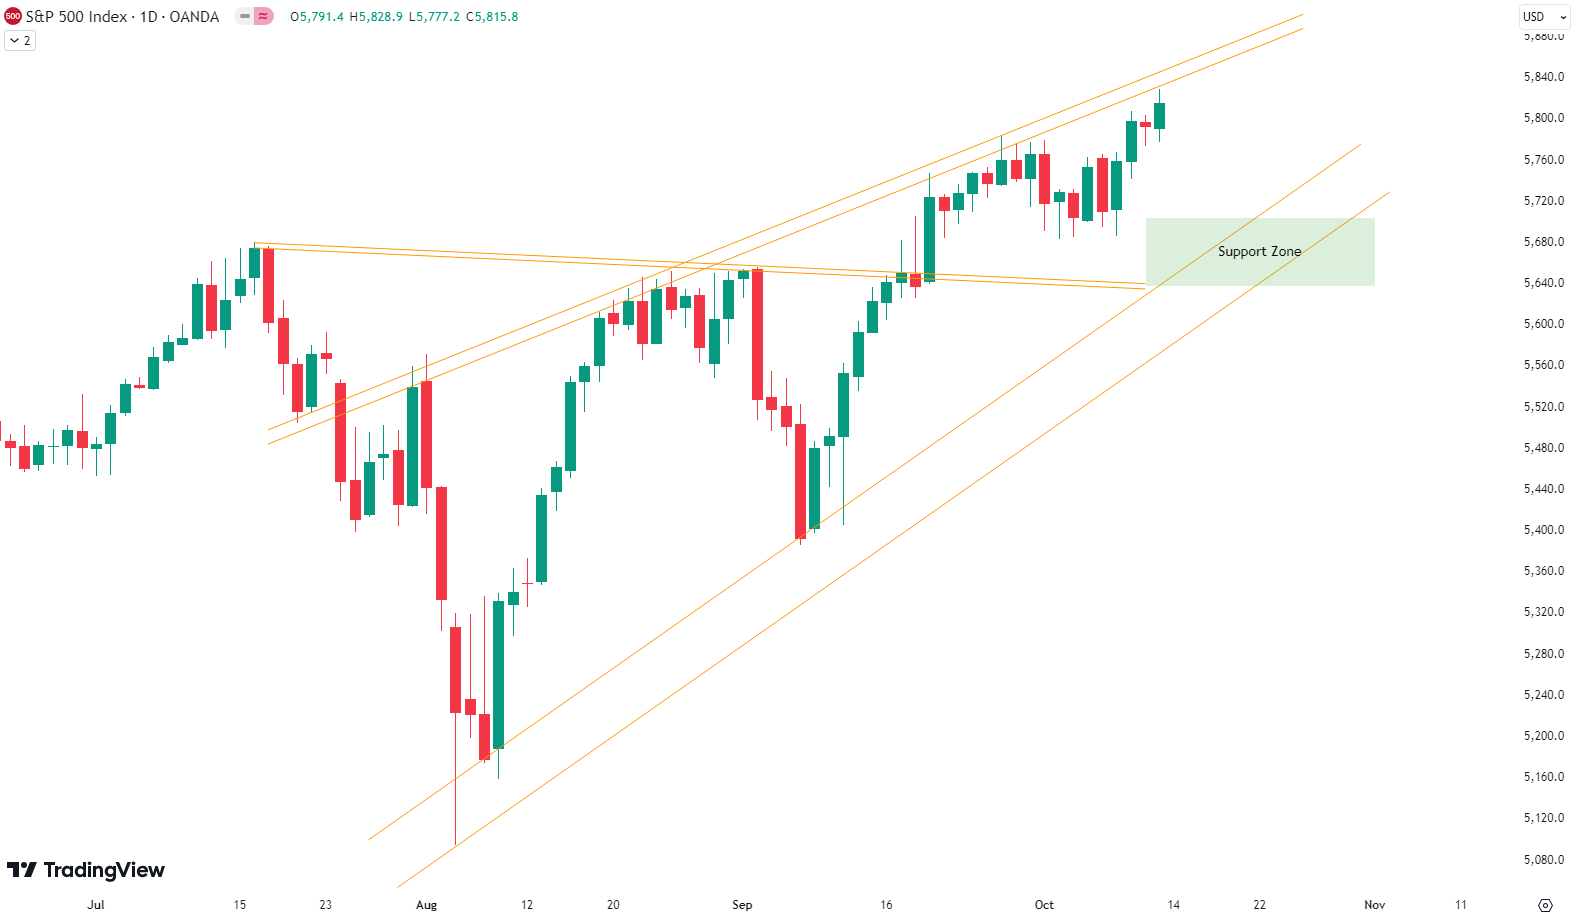
Since the August low, the S&P 500 is up a remarkable 14.2%, showing strong recovery and growth. However, when you zoom out to the daily chart, the index is still moving within a larger rising wedge pattern. The orange trend lines in the chart highlight this pattern, and the S&P 500 is currently nearing the upper boundary.
What does this mean? When a stock or index hits the top of a wedge, it typically indicates that upside potential is limited. In this case, it’s possible that the S&P 500 will face resistance and start moving downward to test the lower trend lines. A retest of the old all-time highs could also be on the horizon, as marked in the chart’s green support zone.
However, with the election just around the corner, increased volatility and corrective action in stock prices are likely. This doesn’t necessarily mean a crash, but beginner investors should be cautious. For subscribers it is very important to follow our risk management measures that we provide with all our services to protect against losses in case support zones break
Die nächsten Monate
The chart shows the typical seasonality for the S&P 500 during an election year, indicating patterns of market behavior around key months. Historically, we see a tendency for market weakness in May, June, and July, followed by a period of strong price gains up to early September. However, this is usually succeeded by a larger correction leading up to the election at the beginning of November. The period from mid-June to the end of July is characterized by some market softness, with only modest upward movement, which aligns with the recent declines we’ve witnessed. As we in October, which is historically a weaker month of the year, we may continue to see this pattern of volatility. Given the historical data, there could be further weakness until the U.S. election on November 5th. However, it’s important to interpret this seasonality with caution, especially this year, as we have already experienced a significant rise in prices. Investors should consider both seasonality trends and our analysis for a balanced view. Proper risk management is essential in navigating these market conditions.

Unser Markt-Dashboard bietet einen schnellen Überblick über die aktuellen Marktbedingungen und, was noch wichtiger ist, das damit verbundene Risiko. Unten sehen sie ein Chart eines unserer Tools, des Risiko-Level-Indikators. Es zeigt das prognostizierte Risiko von 1998 bis 2024. Wenn Sie interessiert sind, können Sie hier unsere Dashboard-Seite besuchen..

Die Welt der Finanzen ist komplex und umfasst viele Fachbegriffe. Für die Erklärung dieser Begriffe empfehle ich das Lexikon von Investopedia. Investopedia dictionary.
Schreibe einen Kommentar