
This week, the S&P 500 experienced a modest 0.2% gain. As you can see from the chart, the market followed a slow-moving path, showing limited action. Last week’s newsletter mentioned the gray trend line on the one-hour chart, and on Friday, the S&P 500 broke below that line. On Monday and Tuesday, the index failed to rally above it and saw a decline on Tuesday, followed by a mostly flat performance for the rest of the week. However, Friday closed with a stronger movement, leaving the market nearly unchanged from where it started the week.

Our last position, which we placed on August 8th, has been active until September 5th, when we sold it for a gain of 7.7%
Sie fragen sich, wann Sie als Investor den S&P 500 kaufen sollten? Entdecken Sie unsere maßgeschneiderten Dienstleistungen und schließen Sie sich unserer wachsenden Gemeinschaft von Do-it-yourself-Investoren an, die sich mit unserer Anleitung erfolgreich auf dem Markt zurechtgefunden haben.
Premium Guide
Advanced Investing Signals
139€ / Monat
Basic Guide
Basic Investing
Signals
49€ / Monat
Simple Guide
Selected
Signals
Kostenfrei
Congratulations! You’ve discovered your new free financial guide. Simply sign up for our most popular service, our Simple Guide.
Market Cycles to Watch
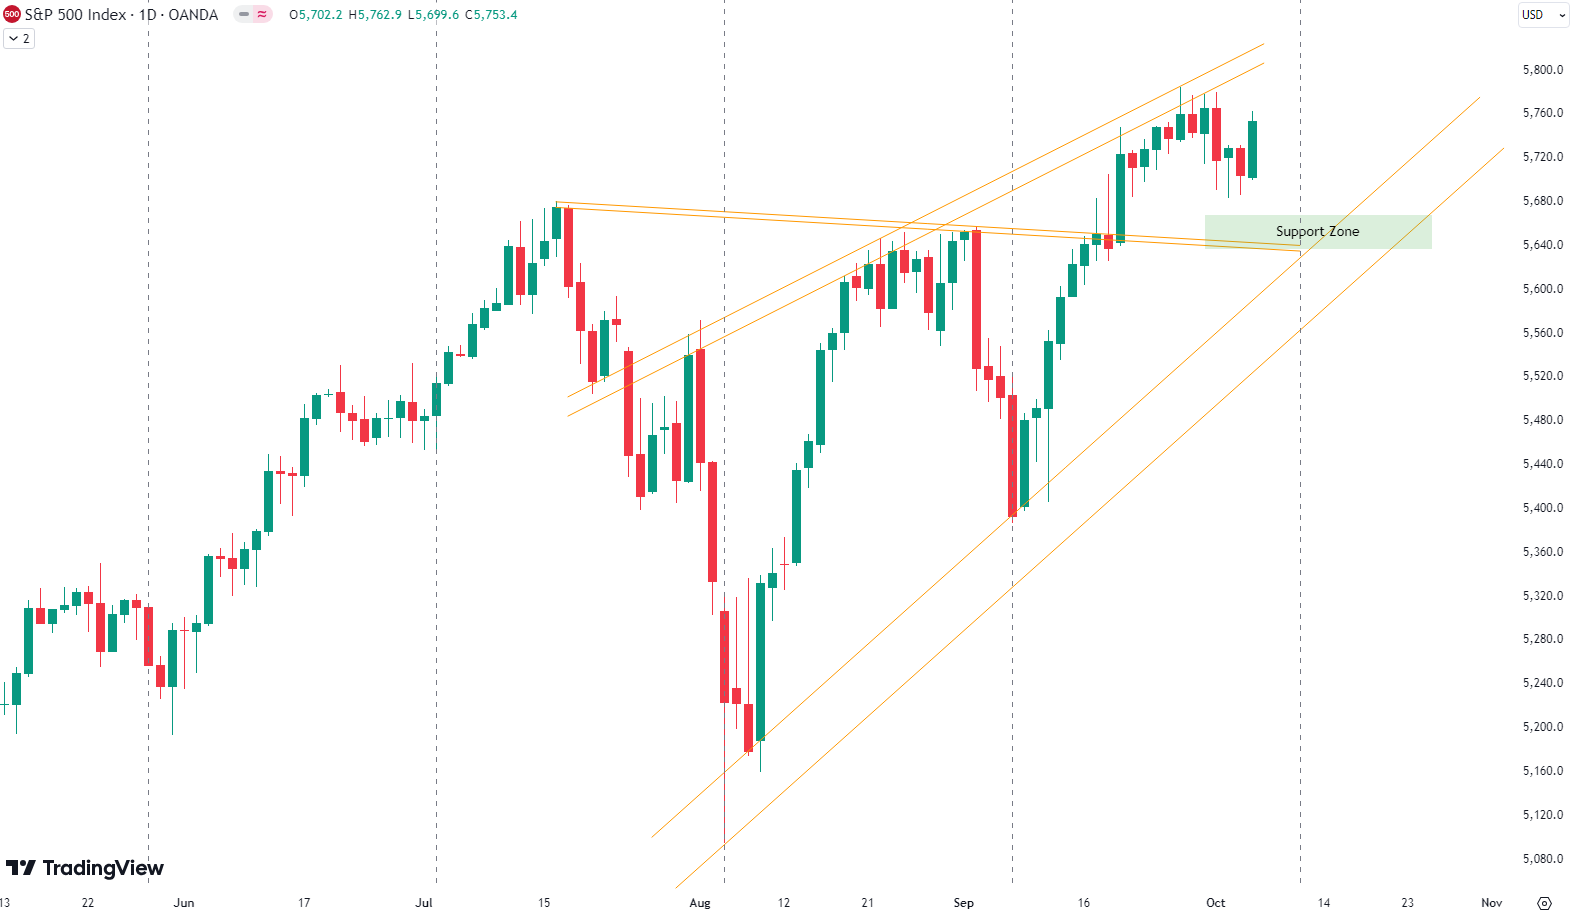
Despite a relatively quiet week, the S&P 500 has been climbing steadily since the August low, now up 12.9%. If you look at the daily chart, you’ll notice the wedge formation marked by the orange upward-sloping trend lines. This pattern typically leads to a breakout, and we’re still watching for the green support zone, which has yet to be tested. This zone, combined with the trend lines, is expected to provide solid support if the market pulls back. Additionally, take note of the black dashed vertical lines on the chart. These lines, spaced 24 trading days apart, highlight a recurring cycle in the market where lows seem to coincide with these intervals. Based on this pattern, we’re approaching the next vertical line, suggesting a potential low in the coming days. While this isn’t a major decision-making tool, it’s an interesting cycle to watch for market timing. If prices do dip into the green support zone, we anticipate a bounce to the upside. Of course, the market could surprise us by skipping the support zone entirely and pushing higher directly from here. The next week should offer more clarity on how this plays out. For subscribers it is very important to follow our risk management measures that we provide with all our services to protect against losses in case support zones break.
Die nächsten Monate
The chart shows the typical seasonality for the S&P 500 during an election year, indicating patterns of market behavior around key months. Historically, we see a tendency for market weakness in May, June, and July, followed by a period of strong price gains up to early September. However, this is usually succeeded by a larger correction leading up to the election at the beginning of November. The period from mid-June to the end of July is characterized by some market softness, with only modest upward movement, which aligns with the recent declines we’ve witnessed. As we move into October, which is historically a weaker month of the year, we may continue to see this pattern of volatility. Given the historical data, there could be further weakness until the U.S. election on November 5th. However, it’s important to interpret this seasonality with caution, especially this year, as we have already experienced a significant rise in prices. Investors should consider both seasonality trends and our analysis for a balanced view. Proper risk management is essential in navigating these market conditions.

Unser Markt-Dashboard bietet einen schnellen Überblick über die aktuellen Marktbedingungen und, was noch wichtiger ist, das damit verbundene Risiko. Unten sehen sie ein Chart eines unserer Tools, des Risiko-Level-Indikators. Es zeigt das prognostizierte Risiko von 1998 bis 2024. Wenn Sie interessiert sind, können Sie hier unsere Dashboard-Seite besuchen..

Die Welt der Finanzen ist komplex und umfasst viele Fachbegriffe. Für die Erklärung dieser Begriffe empfehle ich das Lexikon von Investopedia. Investopedia dictionary.
Schreibe einen Kommentar