
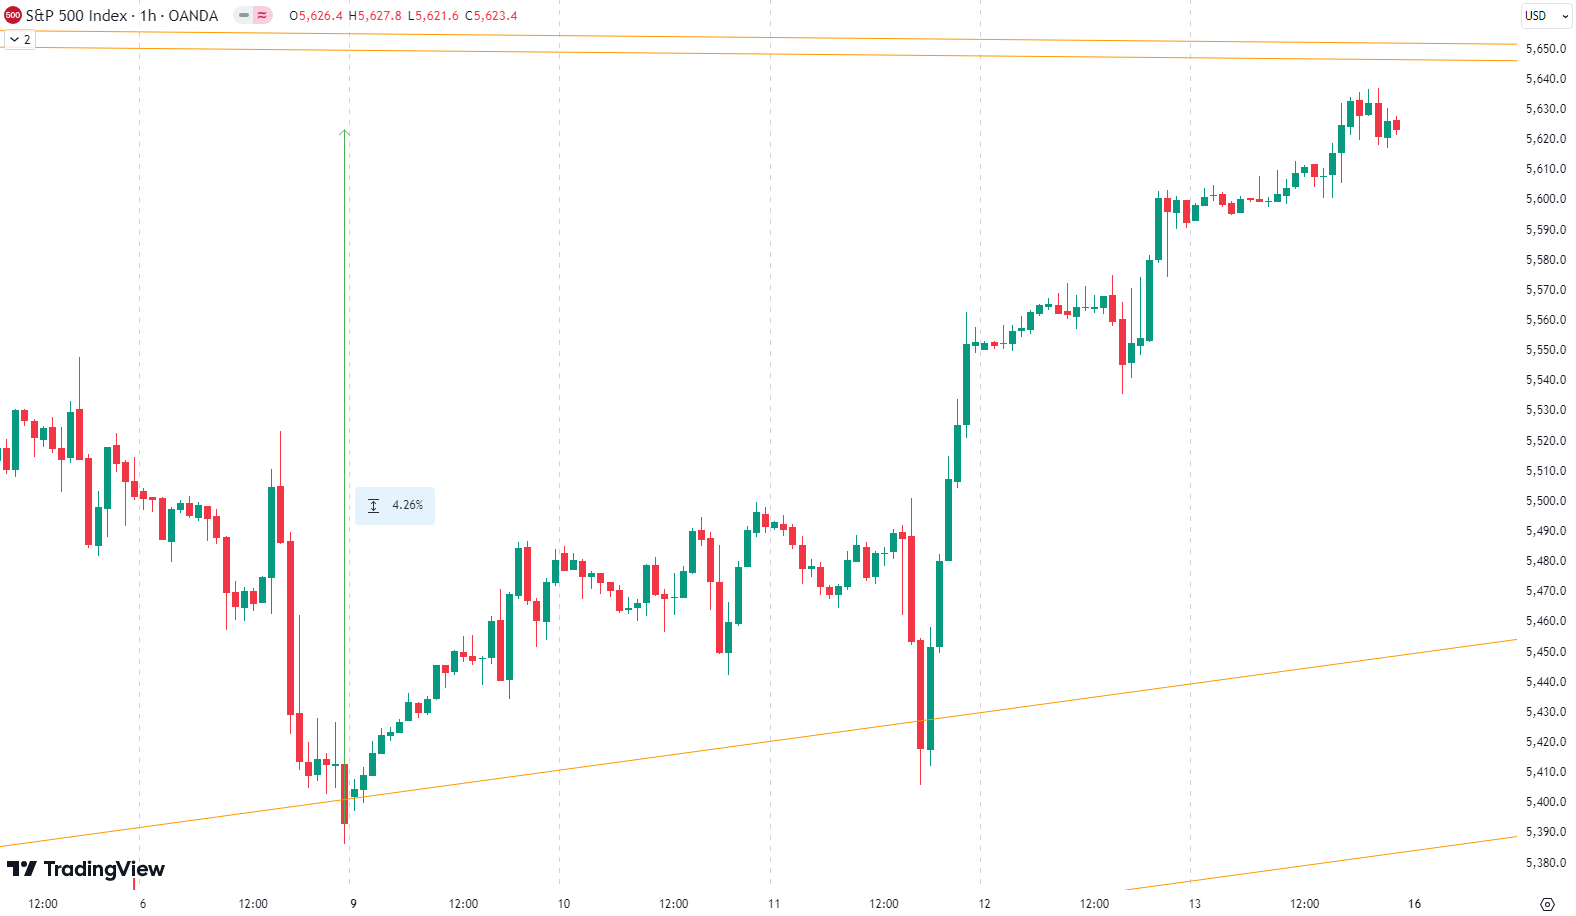
This week was particularly strong for the S&P 500, which gained 4.3%. The market saw minor increases on Monday, followed by a flat Tuesday. However, Wednesday was a rollercoaster of volatility, with a sharp drop of 1.7% within two hours before rallying with an impressive 2.9% rise into the close. Thursday and Friday continued to build on these gains. On the economic front, a key factor was the further slowing of U.S. CPI, alongside the ECB’s decision to lower interest rates. These developments contributed to the strong upward trend observed across the week.
Our last position, which we placed on August 8th, has been active until September 5th, when we sold it for a gain of 7.7%
Sie fragen sich, wann Sie als Investor den S&P 500 kaufen sollten? Entdecken Sie unsere maßgeschneiderten Dienstleistungen und schließen Sie sich unserer wachsenden Gemeinschaft von Do-it-yourself-Investoren an, die sich mit unserer Anleitung erfolgreich auf dem Markt zurechtgefunden haben.
Premium Guide
Advanced Investing Signals
139€ / Monat
Basic Guide
Basic Investing
Signals
49€ / Monat
Simple Guide
Selected
Signals
Kostenfrei
Congratulations! You’ve discovered your new free financial guide. Simply sign up for our most popular service, our Simple Guide.
Watch for Wedge Breakout
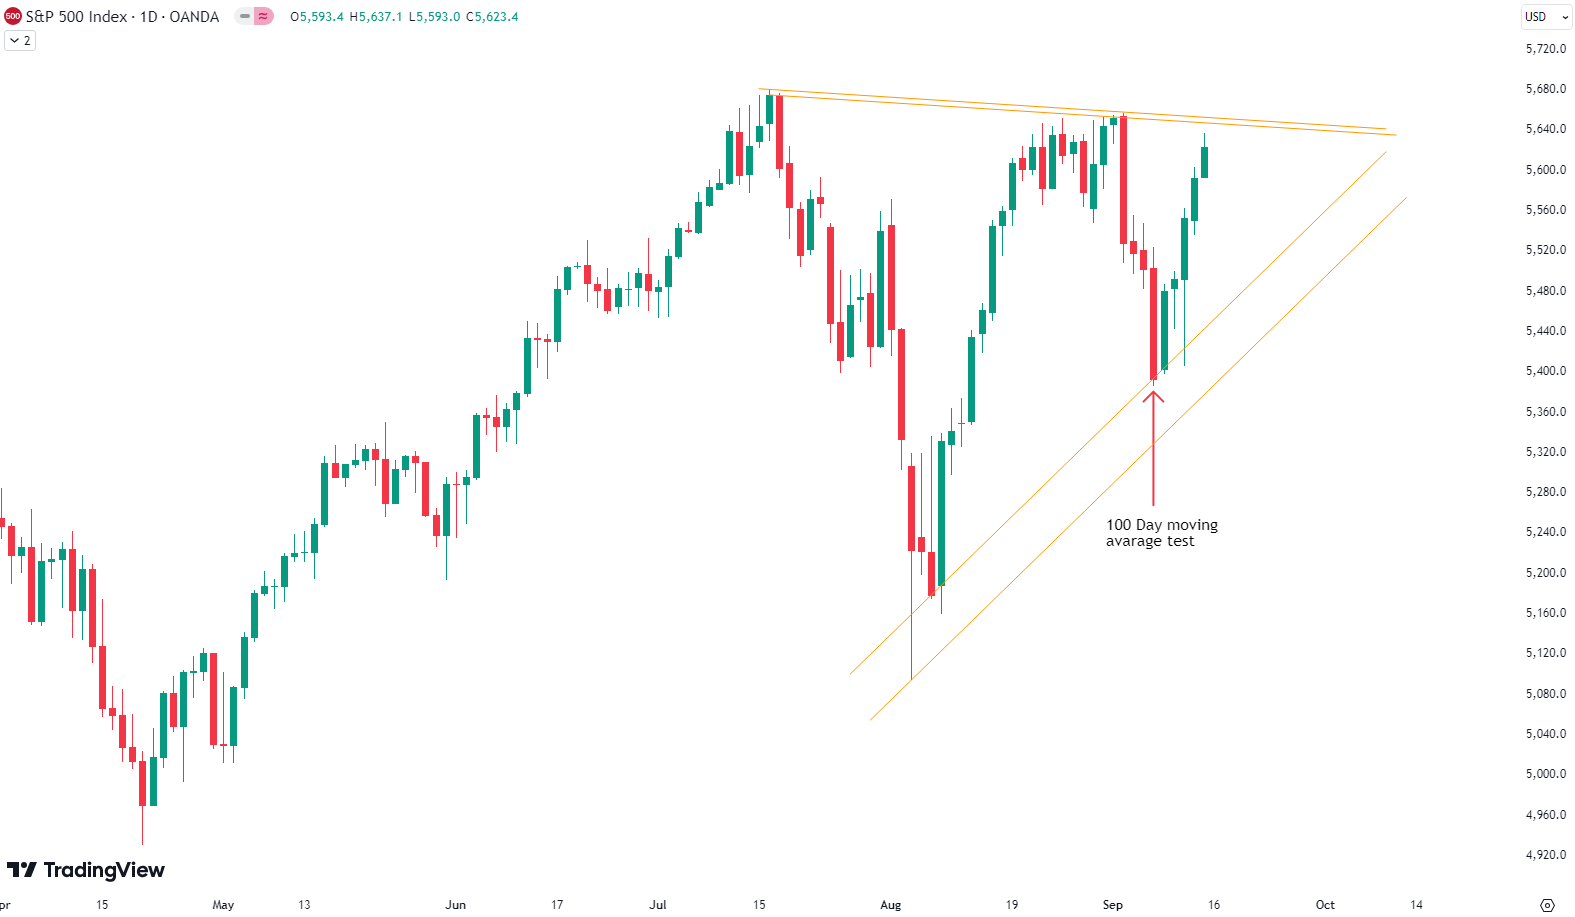
Since the August low, the S&P 500 has surged by 14.6%, signaling a robust recovery. Letzte Woche, we discussed how the index tested its 100-day moving average, and as expected, it found strong support at this level, leading to a powerful bounce. This rebound has pushed the index higher, raising the possibility of reaching all-time highs. However, when we analyze the daily chart, an interesting wedge formation is visible. This pattern consists of converging trend lines that indicate a narrowing of price action. Typically, these wedge formations resolve either upward or downward, and we expect a breakout in the coming weeks, likely leaning towards the upside given historical data. However, we must also consider that the market is currently facing a liquidity bottleneck. These occur four times a year, at the end of each quarter, and the major bottleneck of 2024 is now in September. Reduced liquidity tends to increase volatility, which historically has led to notable declines, particularly in September or March. With upcoming elections adding uncertainty, we recommend caution in the near term. For our subscribers, it’s crucial to adhere to our risk management strategies to navigate potential market fluctuations safely and effectively.
Die nächsten Monate
The chart shows the typical seasonality for the S&P 500 during an election year, indicating patterns of market behavior around key months. Historically, we see a tendency for market weakness in May, June, and July, followed by a period of strong price gains up to early September. However, this is usually succeeded by a larger correction leading up to the election at the beginning of November. The period from mid-June to the end of July is characterized by some market softness, with only modest upward movement, which aligns with the recent declines we’ve witnessed. As we move into September, which is historically the weakest month of the year, we may continue to see this pattern of volatility. Given the historical data, there could be further weakness until the U.S. election on November 5th. However, it’s important to interpret this seasonality with caution, especially this year, as we have already experienced a significant rise in prices. Investors should consider both seasonality trends and our analysis for a balanced view. Proper risk management is essential in navigating these market conditions.

Unser Markt-Dashboard bietet einen schnellen Überblick über die aktuellen Marktbedingungen und, was noch wichtiger ist, das damit verbundene Risiko. Unten sehen sie ein Chart eines unserer Tools, des Risiko-Level-Indikators. Es zeigt das prognostizierte Risiko von 1998 bis 2024. Wenn Sie interessiert sind, können Sie hier unsere Dashboard-Seite besuchen..

Die Welt der Finanzen ist komplex und umfasst viele Fachbegriffe. Für die Erklärung dieser Begriffe empfehle ich das Lexikon von Investopedia. Investopedia dictionary.
Schreibe einen Kommentar