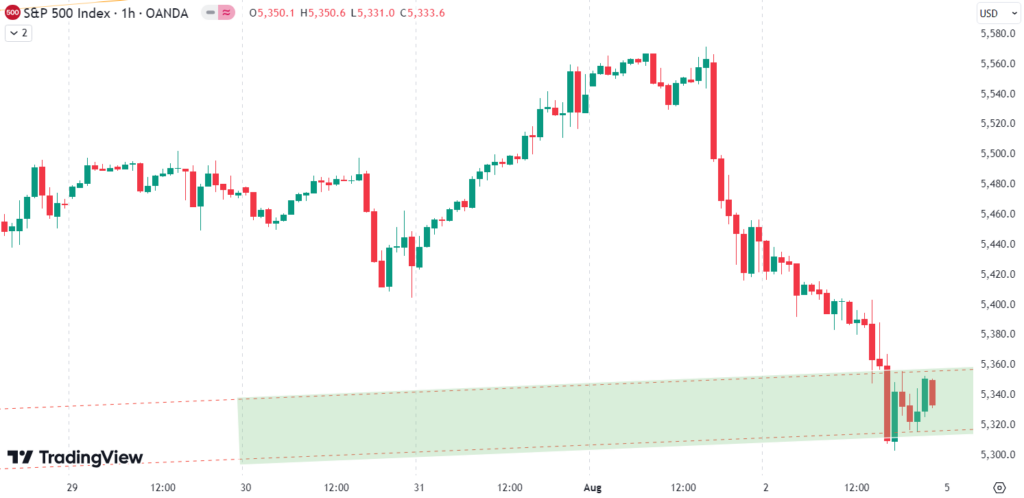
Welcome to our weekly newsletter on the S&P 500. This week, the S&P 500 experienced a loss of 2.5%. The first three days of the week appeared promising, highlighted by a notable 2.4% rally on Wednesday. However, the optimism was short-lived. On Thursday, the S&P 500 abruptly declined 2.5% in just a few hours, a dramatic drop that caught many by surprise. The downturn continued on Friday, resulting in further losses and bringing an end to a highly volatile week.

Our last short position, which we placed on July 18th, has been active until July 31th, when we sold it for a gain of 1,9%
Sie fragen sich, wann Sie als Investor den S&P 500 kaufen sollten? Entdecken Sie unsere maßgeschneiderten Dienstleistungen und schließen Sie sich unserer wachsenden Gemeinschaft von Do-it-yourself-Investoren an, die sich mit unserer Anleitung erfolgreich auf dem Markt zurechtgefunden haben.
Premium Guide
Advanced Investing Signals
139€ / Monat
Basic Guide
Basic Investing
Signals
49€ / Monat
Simple Guide
Selected
Signals
Kostenfrei
Gut gemacht! Sie haben Ihren neuen kostenlosen Finanzratgeber entdeckt. Melden Sie sich einfach für unseren beliebtesten Service und unseren Simple Guide an.
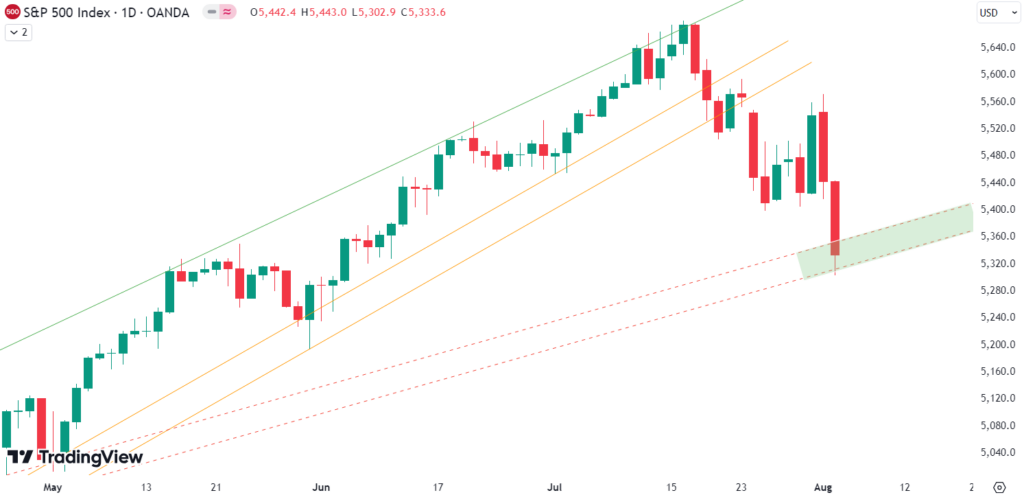
Since the July top, the S&P 500 has declined by 6%. After experiencing losses in previous weeks, this week brought further declines. Wednesday’s rally was anticipated, as sharp declines are often followed by temporary recoveries. This left investors wondering if the bottom was in, but Thursday’s sharp drop answered that question negatively. The decline this week reached our target and has now brought prices down to the support zone we discussed letzte Woche. This support zone is significant, as moving averages, trend lines, and horizontal support all converge here, forming a robust area of potential stability. We expect at least a short-term bounce from this area. The risk-reward ratios are improving, and if we observe positive price action within this support zone, we will take advantage of the situation and enter some long positions. For subscribers, it is crucial to follow our risk management measures provided with all our services to protect against losses in case support zones break. Looking at the technical indicators, it is clear that this support zone is vital for the market’s next move. The convergence of multiple support factors suggests that a bounce is likely, but the market’s reaction in this zone will be critical. Should the S&P 500 hold and rebound from this area, it would confirm the strength of this support. Conversely, a break below this zone could signal further downside risks. In summary, while the recent declines have been challenging, they have brought the S&P 500 to a crucial support level. Investors should watch closely for signs of stabilization and potential upside from this area. Following our risk management strategies will be essential in navigating these uncertain times and capitalizing on the opportunities that arise.

Die nächsten Monate
Das Diagramm zeigt die Saisonalität des S&P 500 in einem Wahljahr und deutet auf eine erwartete Schwäche im Mai, Juni und Juli hin, gefolgt von starken Preisanstiegen bis Anfang September. Darauf folgt dann eine größere Korrektur bis zur Wahl Anfang November. Von Mitte Juni bis Ende Juli deutet die Saisonalität auf eine gewisse Schwäche und nur moderate Preisanstiege hin, was wir mit dem jüngsten Rückgang sicherlich erlebt haben. Jetzt beginnen wir mit dem August, der der Saisonalität zufolge der stärkste Monat des Jahres mit einem durchschnittlichen Gewinn von 3 % ist. Natürlich sollten Saisonalitätsdaten mit Vorsicht betrachtet werden, insbesondere in diesem Jahr, da wir bereits einen deutlichen Preisanstieg erlebt haben. Anleger sollten sowohl Saisonalitätstrends als auch unsere Analyse berücksichtigen, um eine ausgewogene Sichtweise zu erhalten. Ein angemessenes Risikomanagement ist unerlässlich, um diese Marktbedingungen zu meistern.

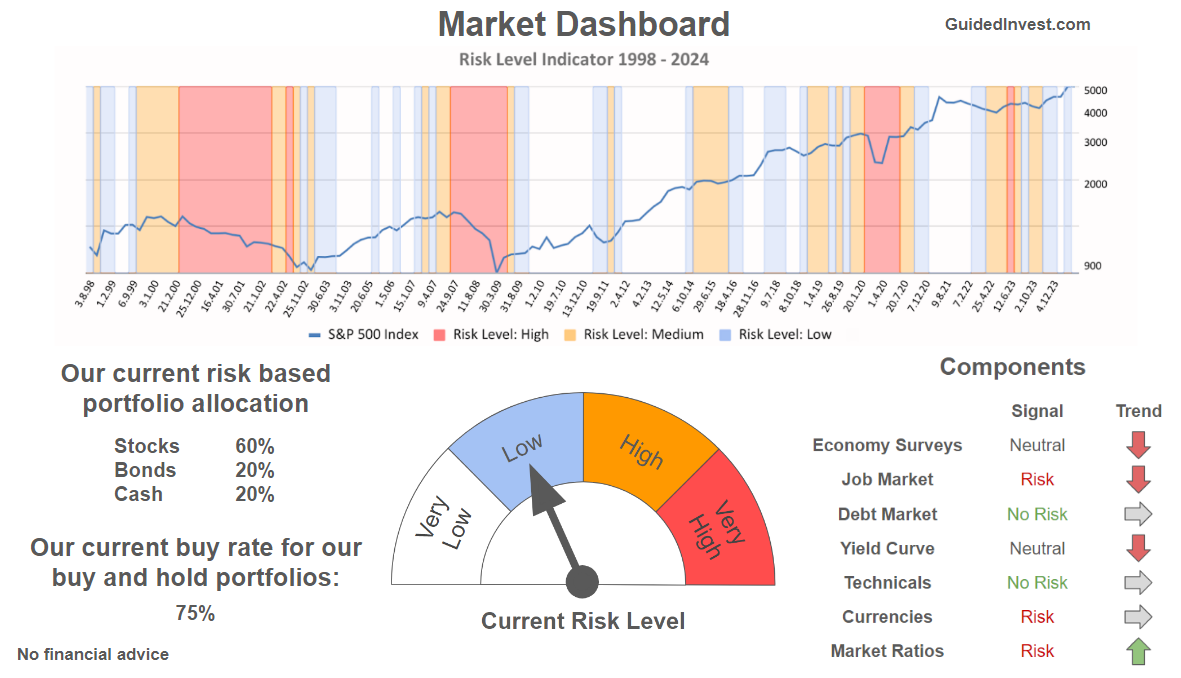
Unser Markt-Dashboard bietet einen schnellen Überblick über die aktuellen Marktbedingungen und, was noch wichtiger ist, das damit verbundene Risiko. Unten sehen sie ein Chart eines unserer Tools, des Risiko-Level-Indikators. Es zeigt das prognostizierte Risiko von 1998 bis 2024. Wenn Sie interessiert sind, können Sie hier unsere Dashboard-Seite besuchen..

Die Welt der Finanzen ist komplex und umfasst viele Fachbegriffe. Für die Erklärung dieser Begriffe empfehle ich das Lexikon von Investopedia. Investopedia dictionary.

Schreibe einen Kommentar