
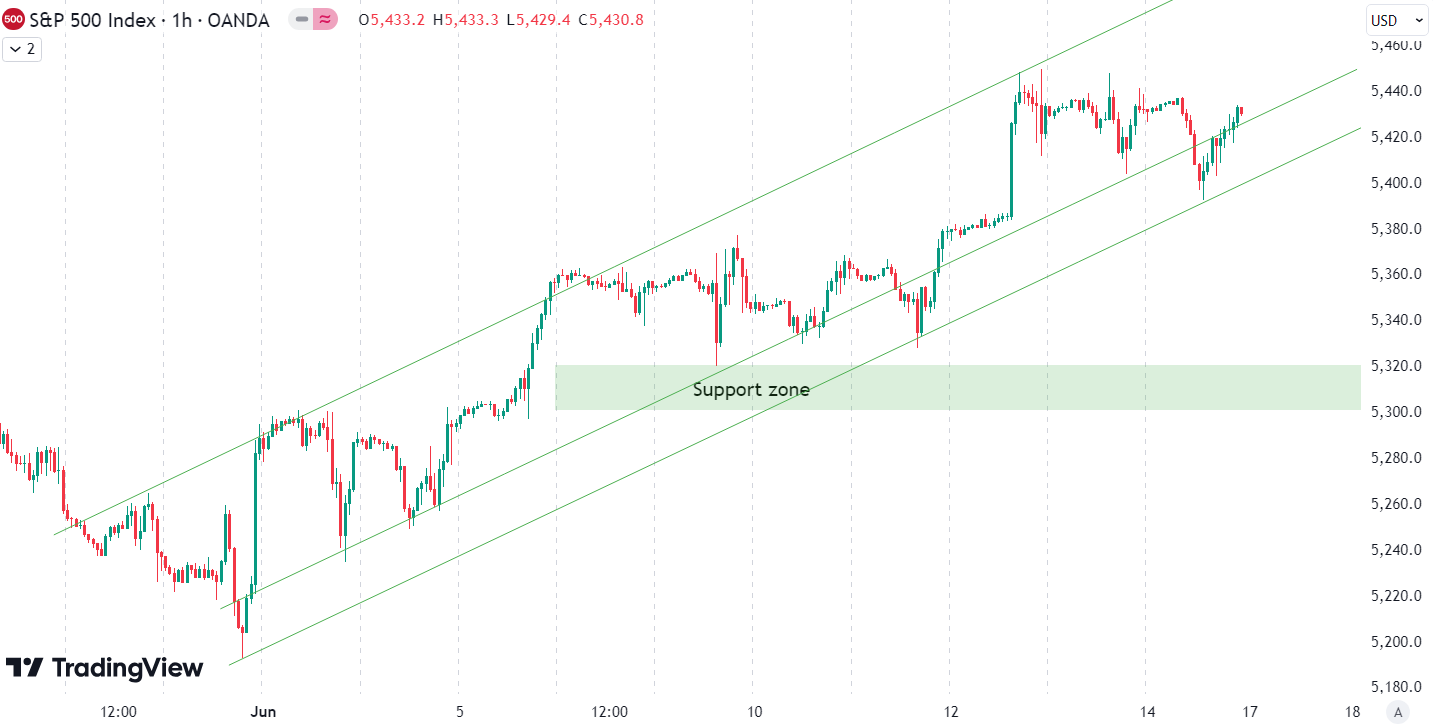
This week the S&P 500 had a gain of 1.6%. The index rallied on Monday, Tuesday, and Wednesday. A dip and quick recovery on Tuesday presented a good buying opportunity. Last week, we wrote about a support zone that held on Friday last week, and since then, the S&P 500 has only gone up. In the past two weeks, the index established a new uptrend (green on the chart). The reason for the strong upward continuation is further weakening economic data, which will likely cause the Fed to cut rates. This expectation is fueling investor optimism and driving the market higher.
Our last position which we placed has been active since April 25th. The position is currently up by 22,1%.
Are you wondering when to buy the S&P 500 as an investor? Explore our tailored services and join our growing community of do-it-yourself investors who have successfully navigated the market with our guidance.

Get started with our most popular service and sign up for our Simple Guide
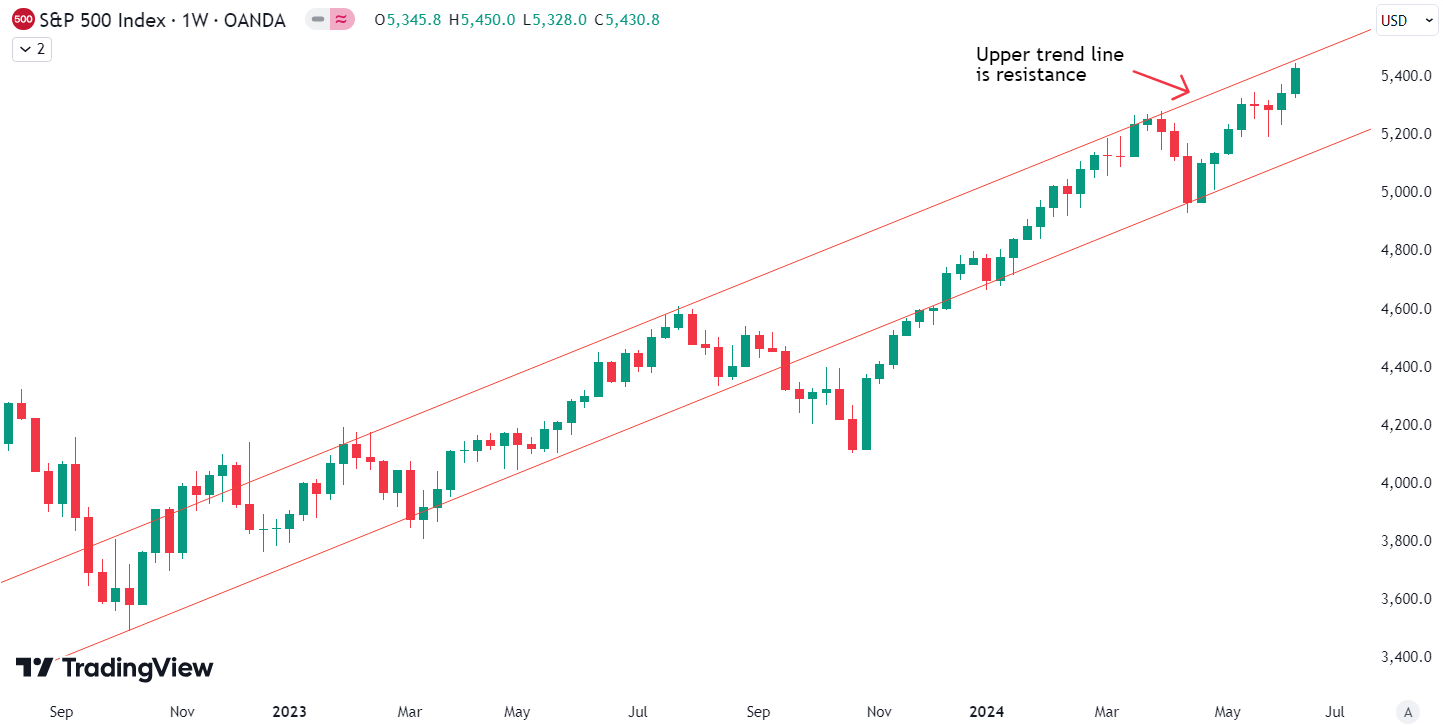
Since the April low, the S&P 500 is up 10.2%. The index had a strong move up in the last two weeks. On a longer-term weekly chart since the October bottom of 2022, you can see the S&P 500 is closing in on the upper trend line (red) that has contained prices since then. In addition, the S&P 500 hit overbought levels on the monthly, weekly, and daily timeframes. This means further upside is likely limited and downside risk is increased. Our indicators will signal profit-taking and position reduction probably in the next two weeks. We will inform our subscribers if that happens. This does not mean a crash will happen, but some kind of pullback is very likely. Monitoring these signals will be crucial for managing risk. Follow us for updates and guidance on navigating these market conditions.
The next few months
On the chart, you can see the seasonality for the S&P 500 in an election year, which anticipates weakness in May and then strongly rising prices until early September. This is followed by a bigger correction until the election in early November. From mid-June to the end of July, seasonality suggests some weakness and only moderate rising prices. This fits very well with our current analysis of overextension to the upside and the probability of some pullback. Of course, the seasonality data should be taken cautiously, especially this year because we have already had a significant rise in prices. Investors should consider both seasonality trends and our analysis for a balanced view. Proper risk management is essential in navigating these market conditions.

The macroeconomic environment is showing negative signs, with our Risk Level Indicator (RLI) increasingly confirming this outlook through various signals. The risk of a credit event remains elevated, adding to the prevailing economic concerns. Of particular note is the Federal Reserve’s Bank Term Funding Program (BTFP), which was initiated in response to last year’s banking crisis to aid banks struggling with high interest rates. However, this program has now expired, and banks are required to gradually repay the loans to the Fed over the course of a year. The RLI will promptly identify emerging issues and adjust the risk level accordingly, providing valuable insights for investors. Currently, a somewhat defensive allocation in stocks is advisable, given the uncertain economic climate.
The world of finance is complex and includes many technical terms. For explanations of these terms, I recommend using the Investopedia dictionary.
Leave a Reply