
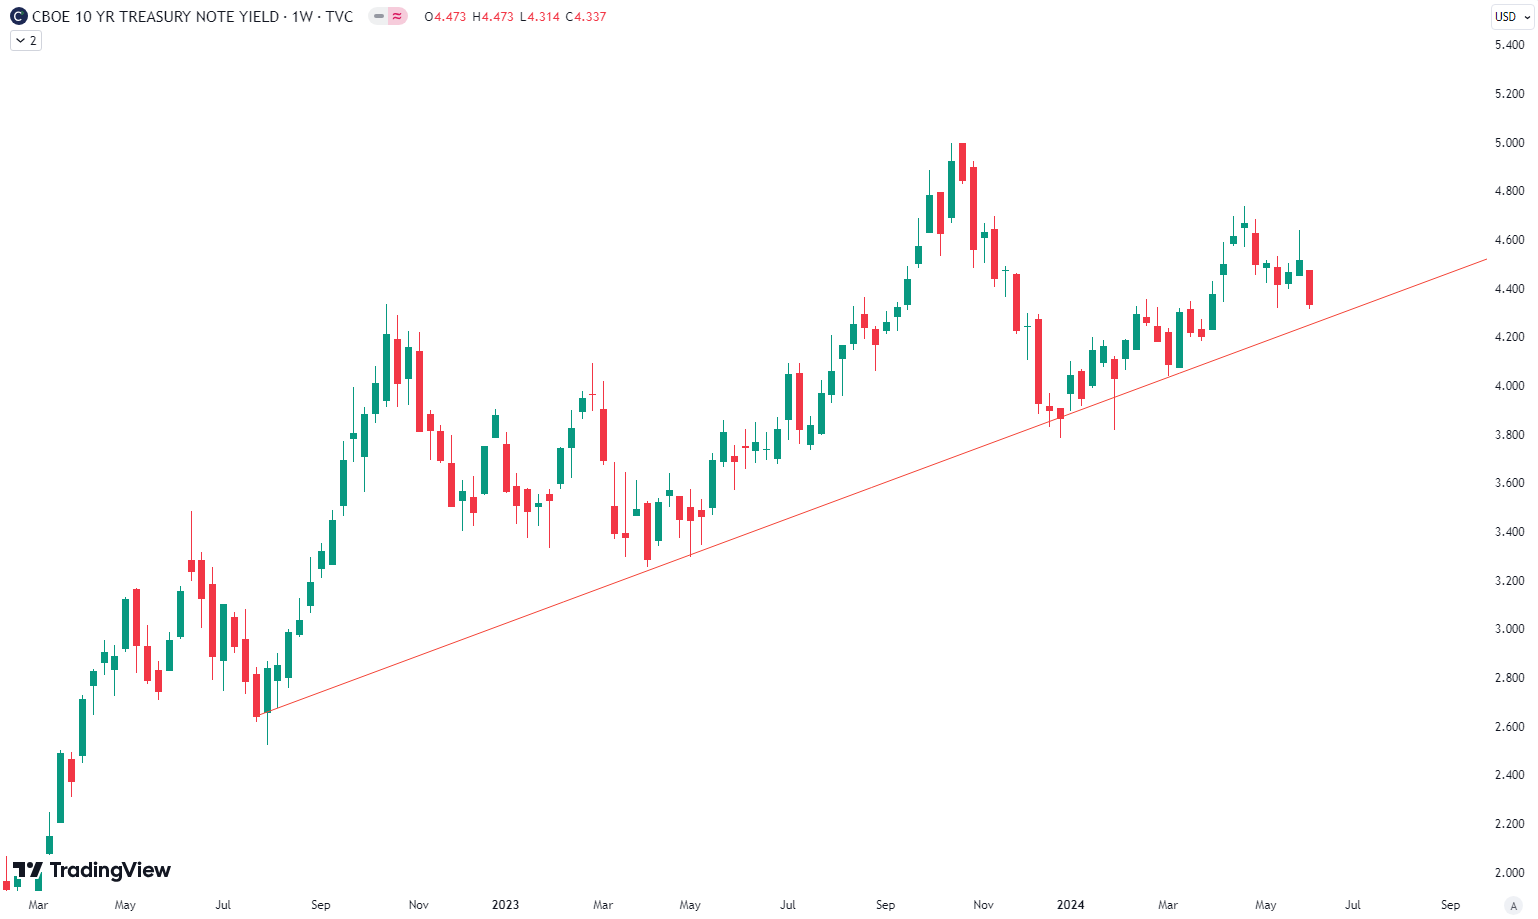
In this week’s post, we will take a close look at the 10-year treasury note yield, which has been rising since the start of the year but showed weakness in the last couple of weeks. This weekly chart of the 10-year yield (TNX) goes back to May 2022. Since then, a nice trend line has been established (red on the chart).
If we zoom in on the daily chart, we can see another trend channel in orange, which has been valid since the start of this year.

In the middle of May, the 10-year yield broke this channel, tested it in the last couple of days, and failed again. Now it is rapidly approaching the long-term trend line in red. This trend line goes back almost two years. If the 10-year yield breaks it, yields could go much lower. Investors should closely monitor this key support level. The breach of the trend channel and the approach to the long-term trend line indicate potential volatility ahead.
Are you wondering when to buy Bonds as an investor? Explore our tailored services. Join those finding answers with us.

Get started and sign up for our Simple Guide
The world of finance is complex and includes many technical terms. For explanations of these terms, I recommend using the Investopedia dictionary.
Leave a Reply