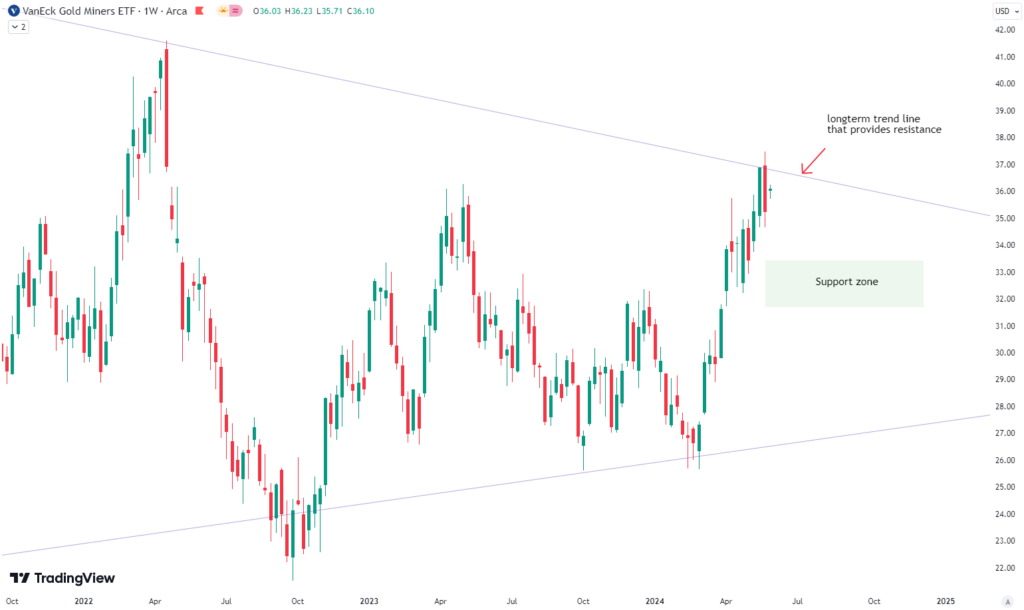
In this week’s post, we will take a close look at the gold miner ETF GDX, which has had a very strong move to the upside in the last three months. On the 20th of March, we described in a post on X how GDX was approaching a long-term trendline and presented a good buying opportunity.
A weekly chart of GDX now shows that it is approaching another long-term trendline that is expected to provide resistance (purple on the chart)

GDX is now very stretched to the upside on a weekly chart, and our own constructed indicators are signaling a sell for GDX. Over the next couple of months, weakness is to be expected for the gold miner ETF. The next support zone on the downside is around $32 – $33. If the ETF comes down into this zone, it would provide a nice entry opportunity. Long term, we remain bullish on GDX. Investors should keep an eye on the mentioned support zone for potential buying opportunities. The current resistance and overbought conditions suggest caution in the next couple of months. Therefore, proper risk management strategies should be employed. Stay tuned for further updates as we monitor the developments in GDX.
Are you wondering when to buy GDX as an investor? Explore our tailored services. Join those finding answers with us.
Get started and sign up for our Simple Guide
The world of finance is complex and includes many technical terms. For explanations of these terms, I recommend using the Investopedia dictionary.


Leave a Reply