
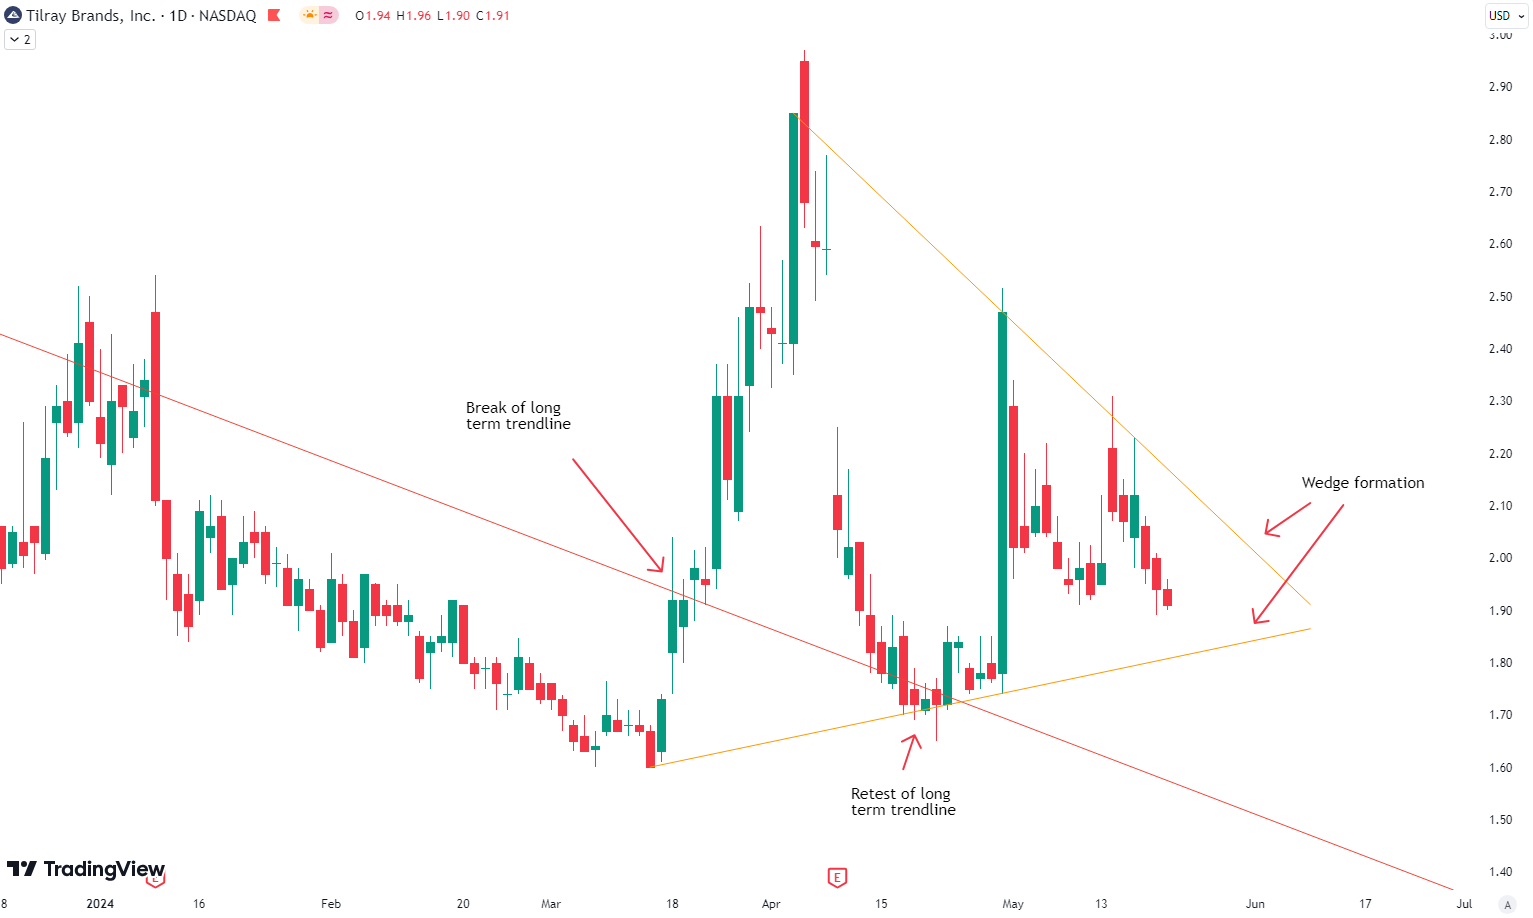
In this week’s post, we will take a close look at Tilray, which has experienced very strong swings in the last couple of weeks. A daily chart of Tilray shows its recent activity.
When should you as an do it yourself investor buy Tilray? If you are interested in receiving our completely free buy and sell signals via email, you can sign up on our email list below.
In March, Tilray broke out of a long-term trendline (red on the chart) that had provided resistance to Tilray’s price for one and a half years. In April, it then came back down to retest that long-term trendline to confirm the breakout. The interesting thing now is that, in this whole process, Tilray created a big wedge formation that has not been broken yet. If it breaks to the upside, it could provide a tremendous opportunity and suggest much higher prices for Tilray. Traders should watch this wedge formation closely. A breakout could signal a strong bullish move.
The world of finance is complex and includes many technical terms. For explanations of these terms, I recommend using the Investopedia dictionary.
Leave a Reply