
In this week’s post, we will take a close look at GameStop, which has had a very strong run in the last couple of days and attracted a lot of media attention. It surged by up to 260% in just two days.
When should you as an investor buy GameStop? If you are interested in receiving our completely free buy and sell signals via email, you can sign up on our email list below.
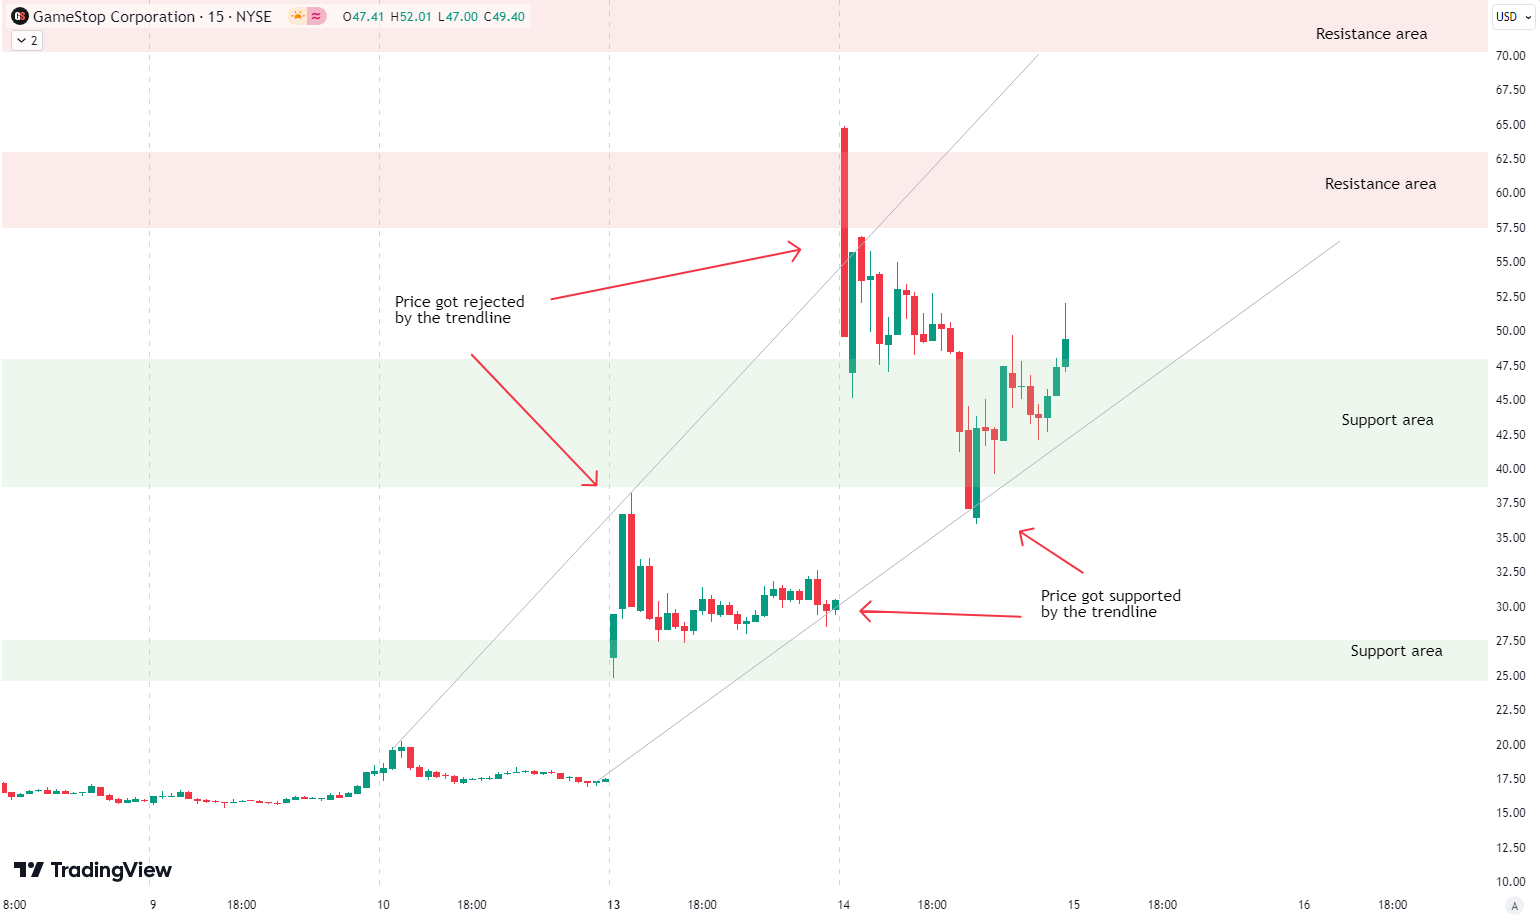
The 15-minute chart of GameStop shows two green shaded areas that currently serve as support and could provide favorable buying opportunities if the price drops to them. The two red shaded areas indicate resistance zones, one of which has already rejected the price once, making them suitable for taking profits if the price enters these zones. Additionally, there are two relevant trendlines; the one below the price has provided support multiple times and could do so again. The trendline above the price has previously rejected it and should be considered for taking profits. Particularly, if the green or red shaded areas converge with the two trendlines, they are expected to provide strong resistance or support. This convergence can enhance the reliability of these zones as critical price levels. Traders should monitor these areas closely to optimize their entry and exit points.
If you are a do it yourself investor and interested in receiving our free trading signals and articles like the one you just read via email, you can register here.
The world of finance is complex and includes many technical terms. For explanations of these terms, I recommend using the Investopedia dictionary.
Leave a Reply