
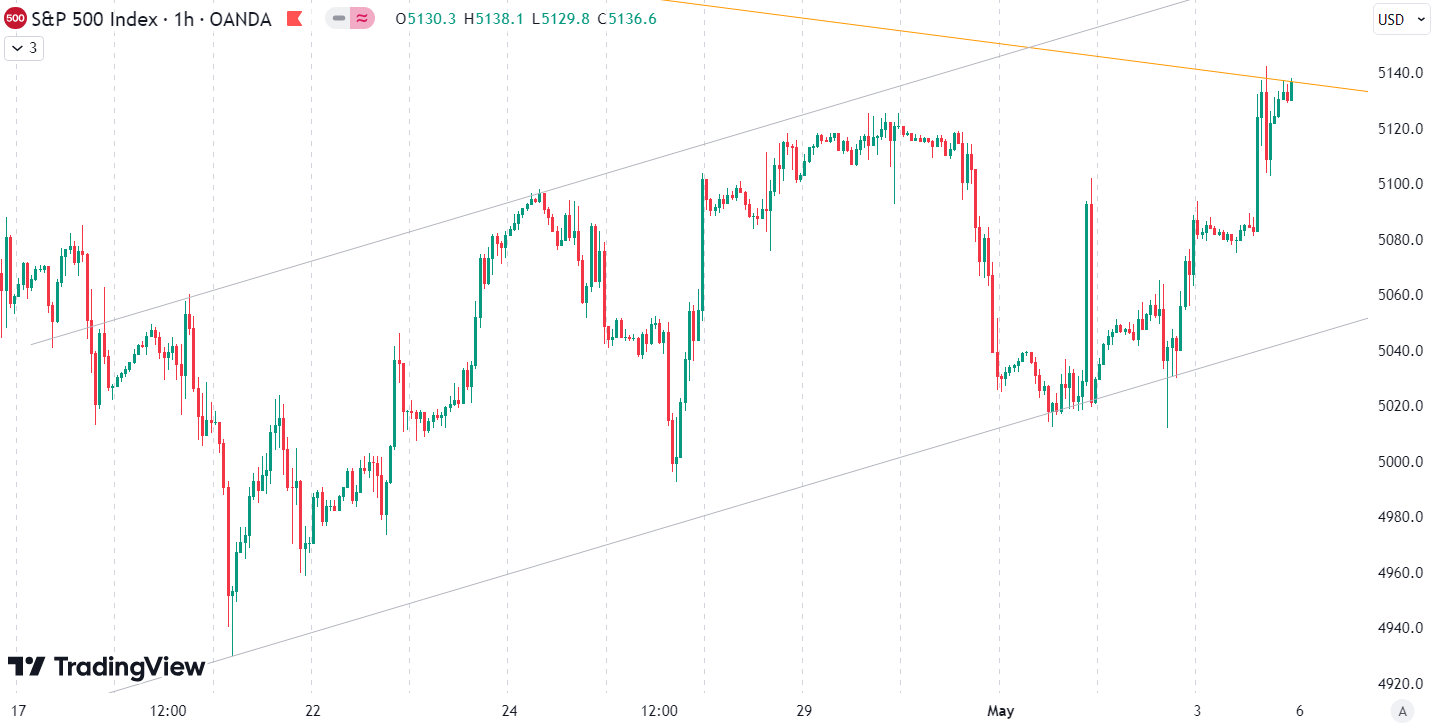
This week, the S&P 500 recorded a modest gain of 0.7%. However, on Tuesday, it experienced a sharp decline ahead of the Federal Open Market Committee (FOMC) meeting of the Fed, scheduled for Wednesday. Throughout Wednesday, Thursday, and Friday, the index had volatile swings, only to conclude the week marginally higher than its starting point on Friday. Over the past two weeks, the S&P 500 has established an uptrend channel (shown in gray on the chart), providing support during the turbulence on Wednesday and Thursday. The primary drivers of this week’s volatility can be attributed to the anticipation surrounding the FOMC meeting and the release of the US job report on Friday.
Our last position which we placed has been active since April 25th. The position is currently up by 4%.
When should you buy the S&P 500? If you are interested in receiving our completely free buy and sell signals via email, you can sign up for our email list below.
The S&P 500 has experienced a significant downward movement since breaking the strong uptrend on April 4th. It plunged by 6.7% from its peak to its trough. In our analysis last week, we highlighted that the index was approaching a resistance zone, characterized by a downtrend line (orange) and the 20- and 50-day moving averages. The index faced strong rejection from this zone on Tuesday but managed to reclaim its position within the zone by the end of the week. On the downside, the 100-day moving average and the longer-term trendline (red) are providing support. Currently, it’s a waiting game to see which level breaks first. If the index surpasses the resistance zone, new all-time highs are likely the next target. However, if it breaches the support zone, new lows and a target zone around 4800 points could come into play.

The next few months
In an election year, the S&P 500 typically experiences a period of weakness in May, followed by a substantial rise in prices leading up to early September. However, this upward trend is often followed by a more significant correction until the election in early November. It’s important to approach the seasonality data with caution, especially this year, given the context of a considerable rise in prices already.

The macroeconomic environment is showing negative signs, with our Risk Level Indicator (RLI) increasingly confirming this outlook through various signals. The risk of a credit event remains elevated, adding to the prevailing economic concerns. Of particular note is the Federal Reserve’s Bank Term Funding Program (BTFP), which was initiated in response to last year’s banking crisis to aid banks struggling with high interest rates. However, this program has now expired, and banks are required to gradually repay the loans to the Fed over the course of a year. The RLI will promptly identify emerging issues and adjust the risk level accordingly, providing valuable insights for investors. Currently, a somewhat defensive allocation in stocks is advisable, given the uncertain economic climate.
If you’re interested in receiving our free trading signals and articles like the one you just read via email, you can register here.
The world of finance is complex and includes many technical terms. For explanations of these terms, I recommend using the Investopedia dictionary.
Leave a Reply