
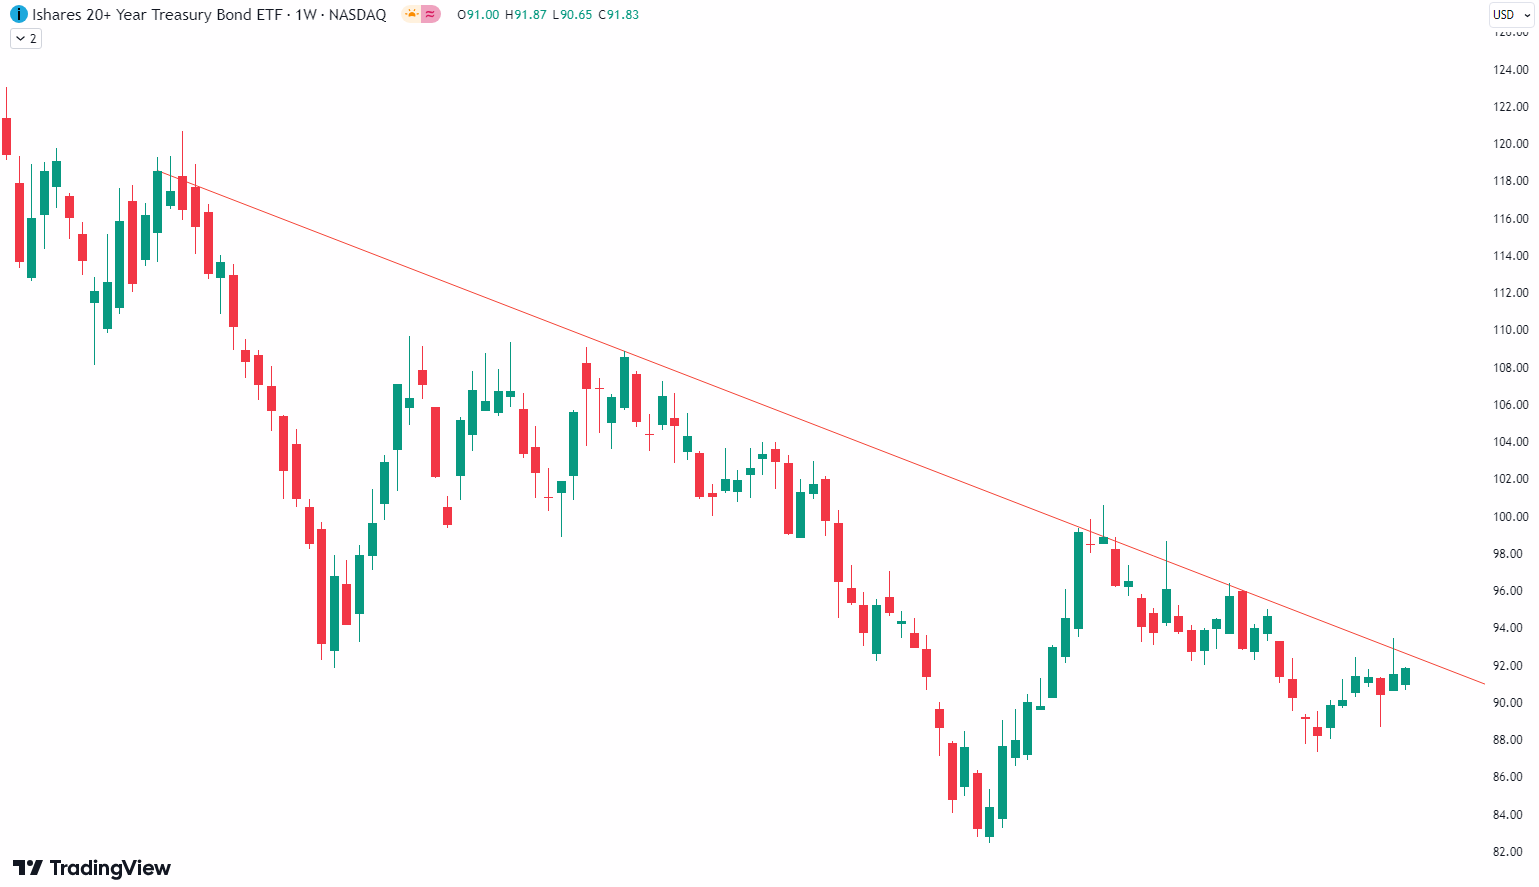
This week’s analysis centers on TLT, a 20+ years Treasury Bond ETF. A weekly chart of TLT that goes back to 2022 shows a long-term trend line has been established (red on the chart). The trend line is being tested right now.
Are you wondering when to buy Bonds as an investor? Explore our tailored services and join our growing community of do-it-yourself investors who have successfully navigated the market with our guidance.

Get started and sign up for our Simple Guide
If we zoom in on the daily chart, we can see another trend channel in orange, which has been valid since the start of this year.
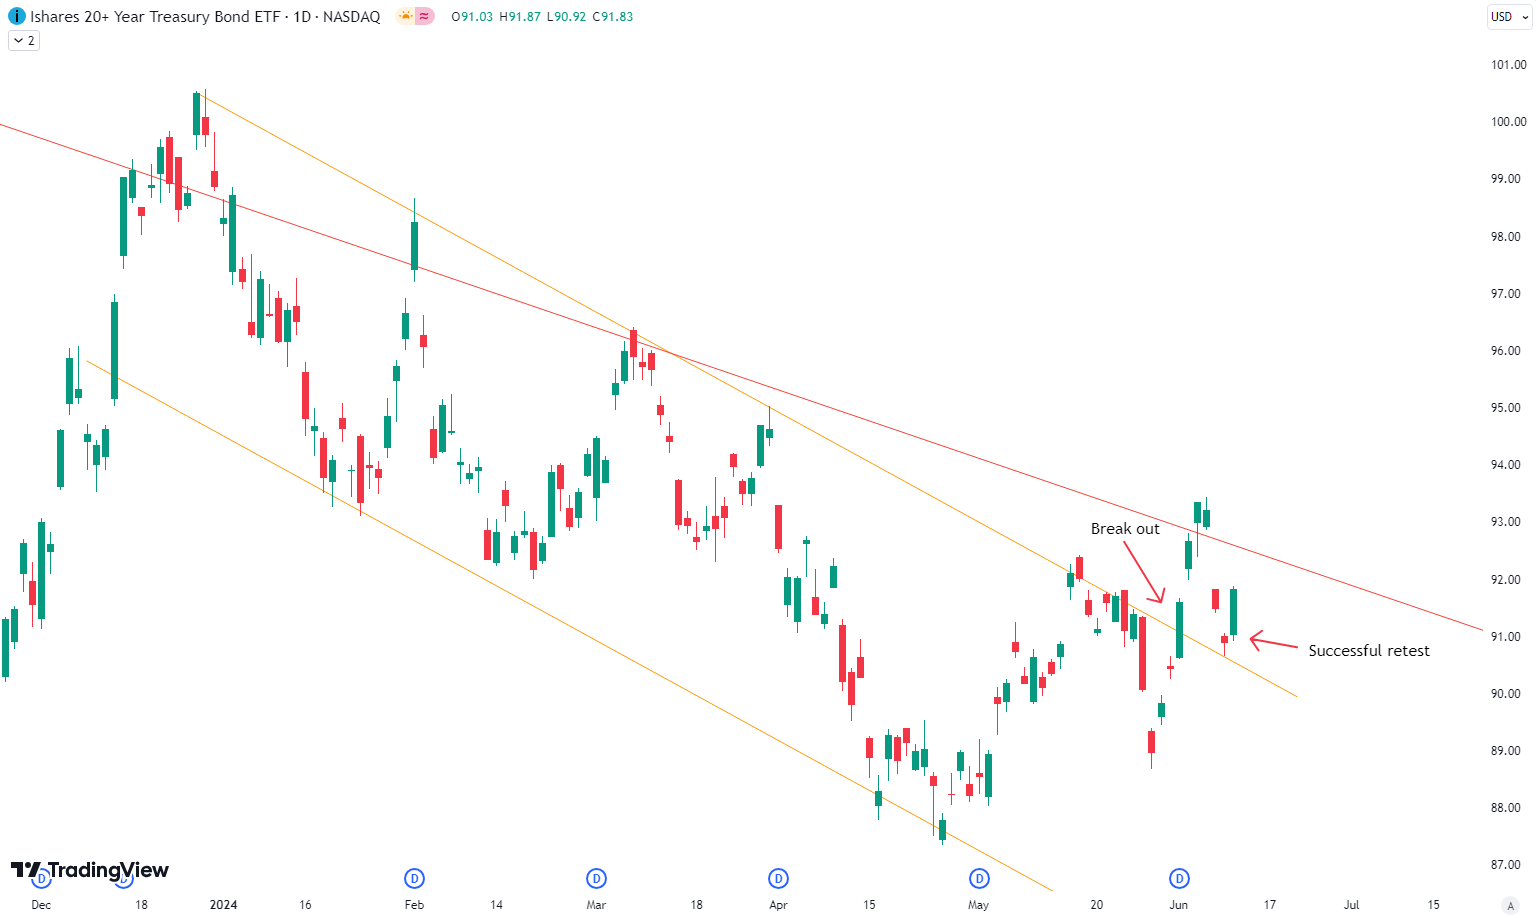
In the beginning of June, the ETF broke out of this channel and tested it successfully in the last couple of days. This all happens right at the long-term trend line in red, suggesting that TLT will also break the long-term trend line and go higher. Of course, the break of the long-term trend line must be confirmed with a successful retest first, but right now, it looks good for bondholders. If the retest holds, it could signal a strong upward move. Investors should keep an eye on these levels for potential buying opportunities. The overall technical setup is promising, indicating potential gains ahead. As always, proper risk management is essential.
The world of finance is complex and includes many technical terms. For explanations of these terms, I recommend using the Investopedia dictionary.
Leave a Reply