
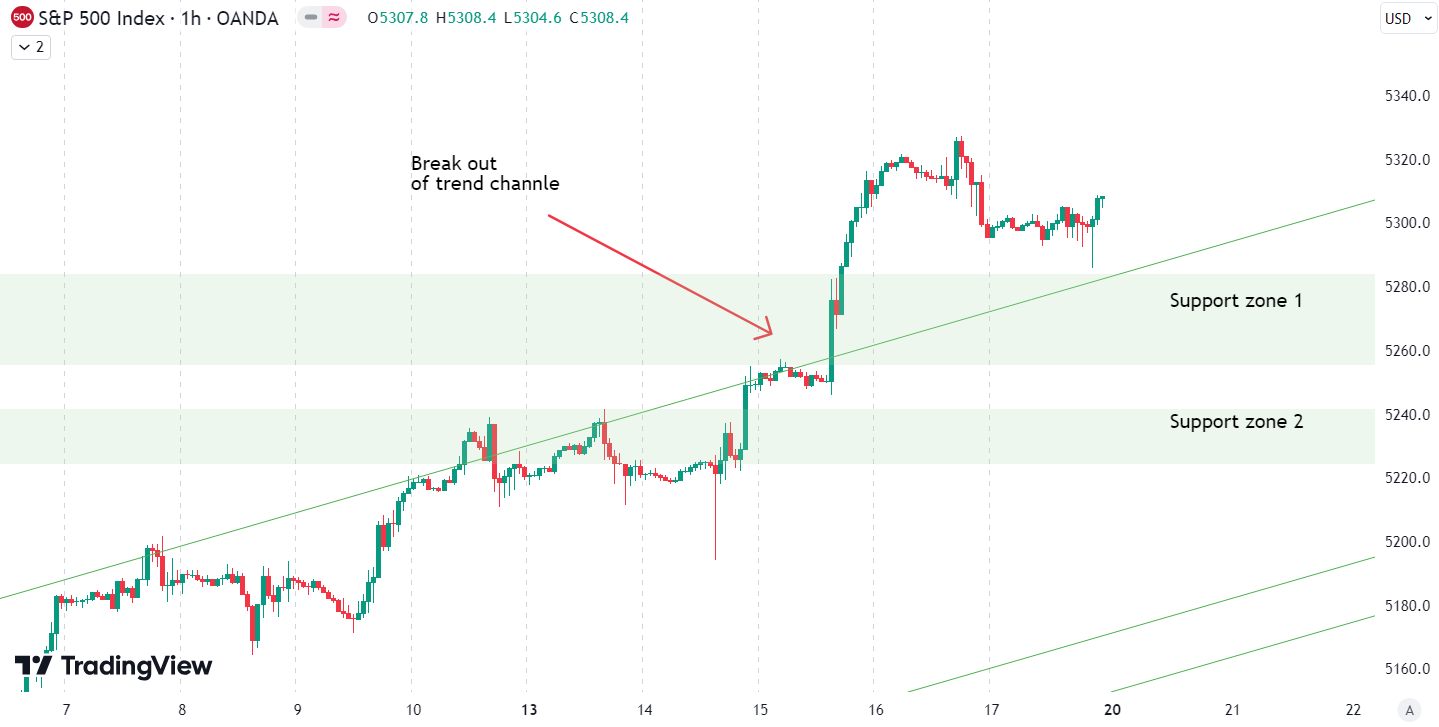
This week, the S&P 500 had a gain of 1.7% and reached new all-time highs, with Wednesday being a particularly strong day. Over the last three weeks, the S&P 500 established an uptrend channel (green in the chart). On Wednesday, the index managed to break out of the trend channel to the upside. This breakout indicates strong bullish momentum in the market. Investors are now watching closely to see if the index can maintain this upward trajectory.
Our last position which we placed has been active since April 25th. The position is currently up by 13,4%.
When should you as an investor buy the S&P 500? If you are interested in receiving our completely free buy and sell signals via email, you can sign up for our email list below.
Last week, we wrote that the index managed to close the week above resistance and it would probably go to new all-time highs. That is exactly what happened this week. However, we also mentioned that a retest of the previous resistance zone was possible and would present a good buying opportunity. Unfortunately, this retest did not occur, and the index went straight up to new all-time highs. The market structure remains bullish, and any retest of support is a buying opportunity. There are two potential support zones to watch. The first one represents the old all-time high from the end of March this year. The second one is a bit further down in price, marking a significant high from April.

The next few months
The seasonality for the S&P 500 in an election year anticipates weakness in May and then strongly rising prices until early September. This is usually followed by a bigger correction until the election in early November. It is possible that the correction in May occurred a month earlier this year, and we are now moving up until September. Of course, the seasonality data should be approached with caution, especially this year because we have already seen a significant rise in prices.

The macroeconomic environment is showing negative signs, with our Risk Level Indicator (RLI) increasingly confirming this outlook through various signals. The risk of a credit event remains elevated, adding to the prevailing economic concerns. Of particular note is the Federal Reserve’s Bank Term Funding Program (BTFP), which was initiated in response to last year’s banking crisis to aid banks struggling with high interest rates. However, this program has now expired, and banks are required to gradually repay the loans to the Fed over the course of a year. The RLI will promptly identify emerging issues and adjust the risk level accordingly, providing valuable insights for investors. Currently, a somewhat defensive allocation in stocks is advisable, given the uncertain economic climate.
The world of finance is complex and includes many technical terms. For explanations of these terms, I recommend using the Investopedia dictionary.
Leave a Reply