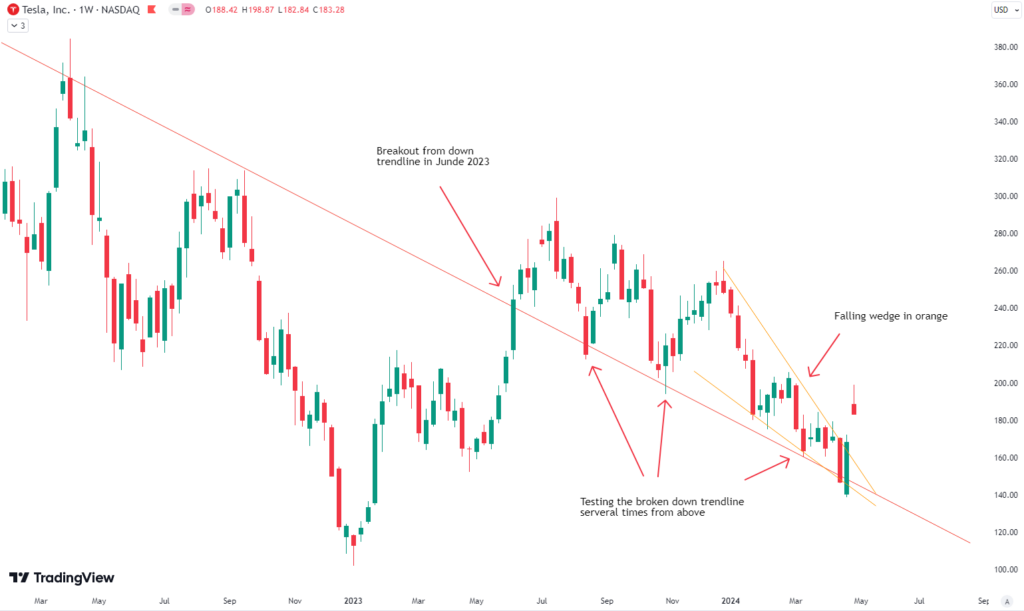
In this week’s post, we’ll analyze Tesla on a technical basis, which has experienced a significant surge following its earnings report. We previously discussed Tesla a few weeks back on X.
As anticipated in that post, the breakout finally occurred

When should you buy Tesla? If you are interested in receiving our completely free buy and sell signals via email, you can sign up on our email list below.
Looking at that weekly chart of Tesla since 2022, we can see that over these two years, it established a downtrend line (red) from which it broke out in June last year. Since then, Tesla has gradually trended lower again, retesting the broken trendline several times from above. This year, Tesla once again moved lower while forming a falling wedge pattern (orange). Now, Tesla has broken out of the wedge and could present a promising buying opportunity on a slight pullback. The first target on the upside would be around $220, where some resistance is expected.
If you’re interested in receiving our free trading signals and articles like the one you just read via email, you can register here.
The world of finance is complex and includes many technical terms. For explanations of these terms, I recommend using the Investopedia dictionary.

Leave a Reply