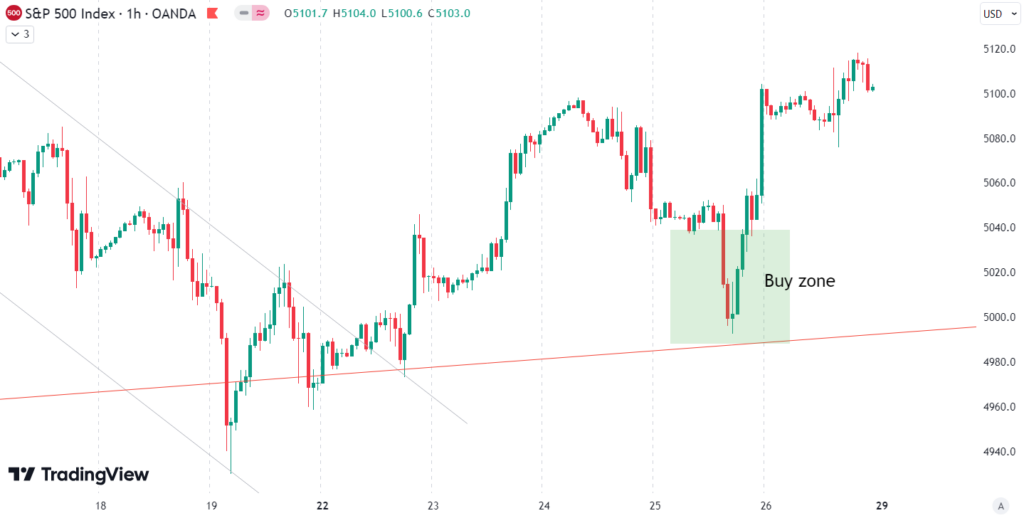
This week, the S&P 500 posted a gain of 2.7%, marking a notable improvement in market performance. As noted in last week’s analysis, the index had established a downtrend (gray) on the 1-hour time frame, as shown in the chart. However, on Monday of this week, the S&P 500 successfully broke out of this downtrend and experienced a strong upward movement until Wednesday. Nonetheless, Thursday saw a sharp drop in prices, but a quick recovery followed. We capitalized on this opportunity, taking advantage of the buying opportunity in the green zone as indicated in the chart.

Our last position which we placed has been active since April 25th. The position is currently up by 3.4%.
When should you buy the S&P 500? If you are interested in receiving our completely free buy and sell signals via email, you can sign up for our email list below.
Since the break of the strong uptrend on April 4th, the S&P 500 has experienced a significant downward movement. It has declined by -6.7% from its peak to trough, indicating substantial selling pressure. Last week, we discussed the possibility of a bounce out of a minor support trendline, we got exactly that. As you can see in the chart, the S&P 500 is now approaching a resistance zone comprising a downtrend line marked in orange and the 20 and 50 daily moving averages. If the index manages to surpass this resistance zone, it would signal the end of the correction and new highs. However, if it fails to do so, we may see new lows, with the target zone on the downside around 4800 points coming back into play, as mentioned last week.

The macro environment remains negative, with various signals from the Risk Level Indicator (RLI) increasingly confirming this. My baseline scenario anticipates rising stock prices until the recession in the USA or a credit event in the spring of 2024. Particularly noteworthy is the Federal Reserve’s Bank Term Funding Program (BTFP), which was launched after last year’s banking crisis to assist banks facing difficulties due to high interest rates. This program has expired, and banks now must gradually repay the loans to the Fed over a year. The RLI will detect emerging issues in a timely manner and adjust the risk level accordingly. At the moment, a somewhat defensive allocation in stocks is recommended.
If you’re interested in receiving our free trading signals and articles like the one you just read via email, you can register here.
The world of finance is complex and includes many technical terms. For explanations of these terms, I recommend using the Investopedia dictionary.

Leave a Reply